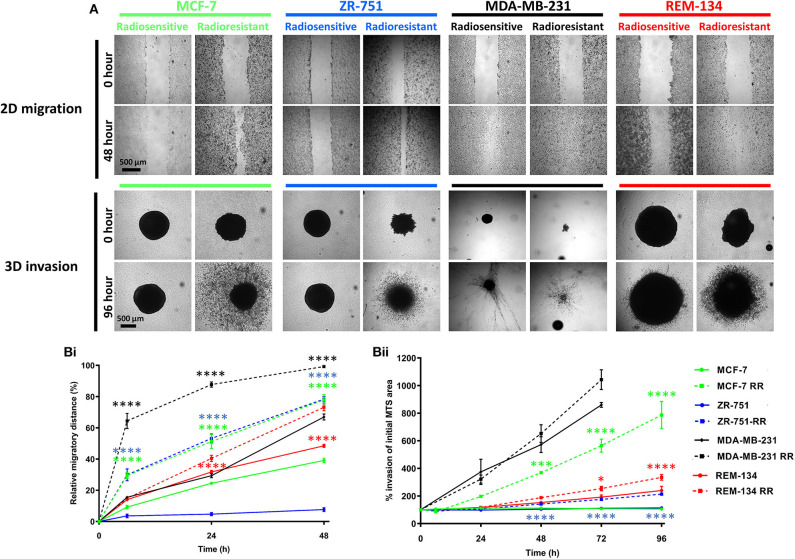
Figure 6.
Radioresistant cell lines have increased migration and invasion potential. (A) Images of 2D migration and 3D MTS invasion assays comparing the parental and the derived RR cell lines. (B) Graphs exhibiting the migration (Bi) and invasion assay (Bii) results. For the migration assays the relative migratory distance was calculated at each time point up to 48 h and expressed as a % area devoid of cells based on the initial scratched area at day 0. Invasion was assessed up to 96 h post-seeding. Area of MTS at each time point was calculated and expressed as a % of initial MTS area at day 0 (2-way ANOVA with Holm-Šídák multiple comparisons test; data expressed as mean ± SEM, n = 3, ****p ≤ 0.0001; ***p ≤ 0.001; *p ≤ 0.05.

