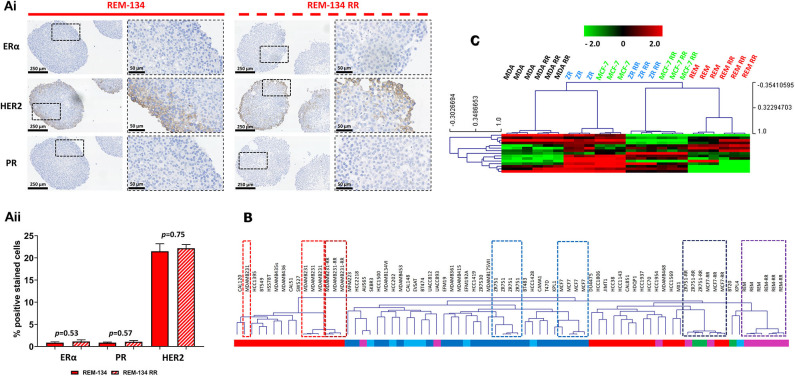
Figure 8.
Breast cancer receptor status, ER signaling and intrinsic breast cancer subtype in the canine and human parental and RR cell lines. (Ai) IHC of ERα, HER2 and PR expression in REM-134 and REM-134 RR MTS. (Aii) Quantitative analysis of the % of ERα, PR and HER2 positively stained cells (unpaired, two tailed t-test; data expressed as mean ± SEM, n = 3). (B) The data generated within this study was integrated with a public gene expression dataset (GSE50811) of 51 breast cancer cell lines. Hierarchical clustering of parental and RR cell lines was based on the Sørlie 2003 intrinsic genes (24); subgroup classification was based on correlation to centroids and was performed using the genefu packaging in R; red = basal, dark blue = luminal A, light blue = luminal B, purple = HER2-overexpressing, green = normal-like. (C) Heatmap showing the log2 mean-centered expression profile of a published ER signaling gene signature (56); red = higher expression, black = no change, green = lower expression. Heatmap clustering was carried out using Pearson correlation with average linkage.

