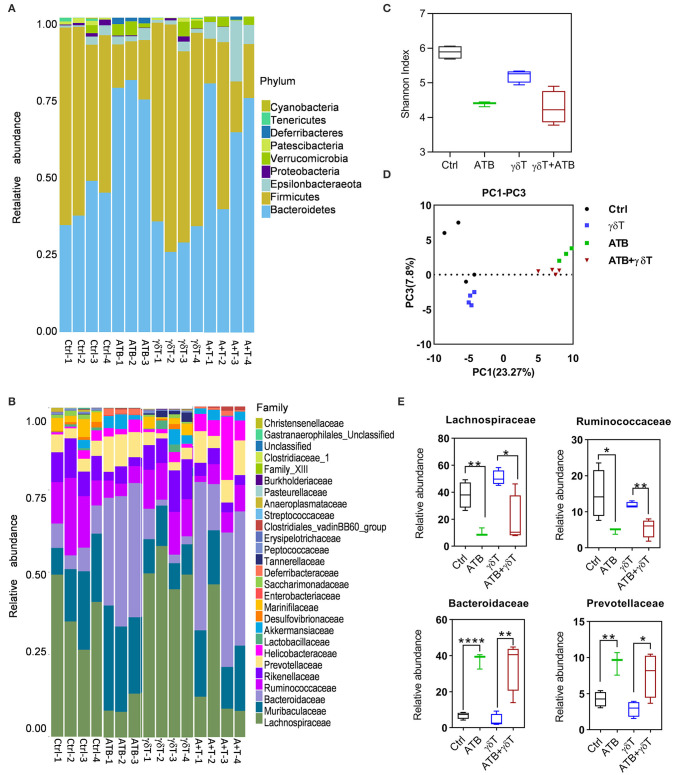
Figure 2.
ATB treatment also changed the gut microbiota in tumor-bearing nude mice. (A) Relative abundance of the microbiota in the cecum of tumor-bearing mice at the phylum level. The columns represent the relative abundance of each sample, and the colors indicate the phylum name of the microbiota. (B) More details on the relative abundance of microbiota in the cecum at the family level. (C) α Diversity of samples in (A); the X-axis represents group information, and the Y-axis represents the Shannon index. The higher the Shannon index is, the higher the diversity is. (D) Principal coordinate analysis shows the diversity of the samples in (A); the X-axis represents the sample distribution in PC1, and the Y-axis represents the sample distribution in PC2. The greater the distance between two points is, the more different the abundance and diversity of the species contained in the two samples is. (E) Relative abundance of the four most significant families among these four groups of mice. Student's t-test. *p < 0.05, **p < 0.01, and ****p < 0.0001.

