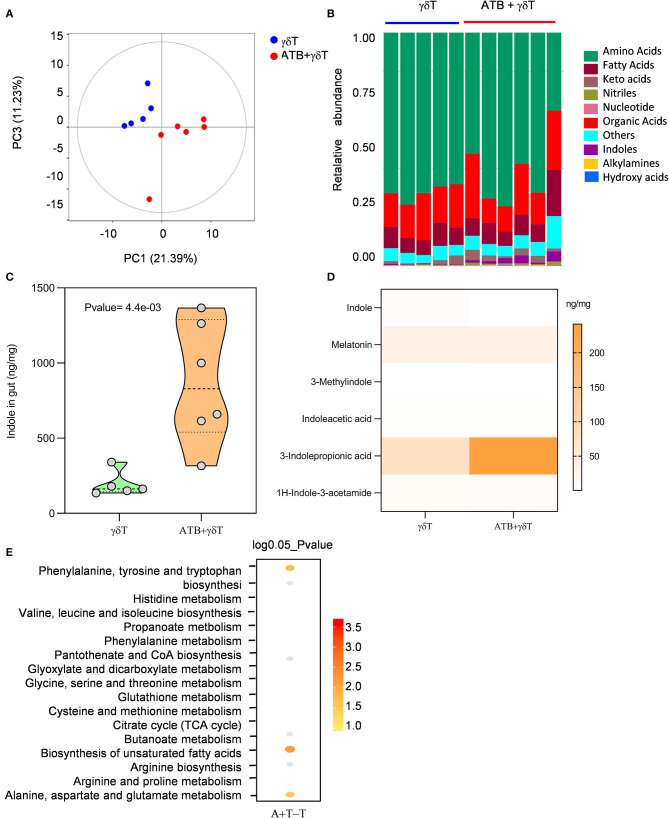
Figure 5.
More 3-indolepropionic acid is produced in mice treated with antibiotics combined with γδT cell therapy. (A) Metabolites were detected in the cecum content by gas chromatography/mass spectrometry. Principal coordinate analysis shows the distribution of the samples in two principal components. The distance between the sample points represents the similarity of the metabolite communities in the sample; the closer the distance, the higher the similarity. (B) Relative abundance of metabolites in the same samples as (A). (C) Concentration of indoles in samples from the γδT cell therapy group (n = 5) and the antibiotic combined with γδT cell therapy group (n = 6). Student's t-test. (D) Concentration heatmap of all listed indoles in the two groups. (E) MPEA analysis to predict which pathway contributes to the metabolic differences between the γδT cell therapy mice and the antibiotic-treated mice. The dot position on the Y-axis refers to a metabolic pathway; the color scale indicates the p-value, with darker dots indicating stronger correlations with the corresponding pathway.

