
TABLE 1.
Features of the OTUs obtained from amplicon sequencing of the 16S rRNA gene and comammox amoA gene.
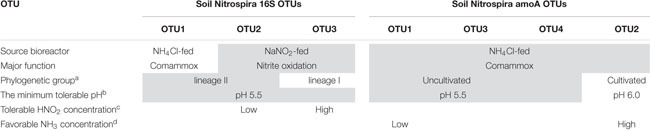 |
The gray cells represent common features of several OTUs. Empty cells represent no data. aOTUs were classified based on phylogenetic analyses of the 16S rRNA gene sequences (Figure 4) and AmoA amino acid sequences (Figure 6). bAll soil Nitrospira 16S OTUs were detected throughout the incubation regardless of the pH decrease from 6.0 to 5.5 (Figures 3C,D). Likewise, soil Nitrospira amoA OTU1, OTU3, and OTU4 were detected at pH 5.5 (Figure 5). On the other hand, soil Nitrospira amoA OTU2 was detected at only pH 6.0 (Figure 5). cSoil Nitrospira 16S OTU2 decreased its relative abundance with exposure to 6.8 μM HNO2 on day 308 (Figures 1D, 3D); meanwhile, the relative abundance of soil Nitrospira 16S OTU3 increased. From these results, soil Nitrospira 16S OTU3 would be tolerable to relatively high concentration of HNO2. dThe concentration of NH3 in the NH4Cl-fed bioreactor was 6.6 ± 1.2 μM during days 165–205 (Figure 1C). Just after this period, on day 206, soil Nitrospira amoA OTU1 dominated among the comammox community (Figure 5). Afterwards, the NH3 concentration increased to 14.9 ± 3.2 μM during days 206–373 (Figure 1C). In this period, soil Nitrospira amoA OTU2 became dominant instead (Figure 5). Thus, soil Nitrospira amoA OTU2 could be adapted to relatively high NH3 concentration.