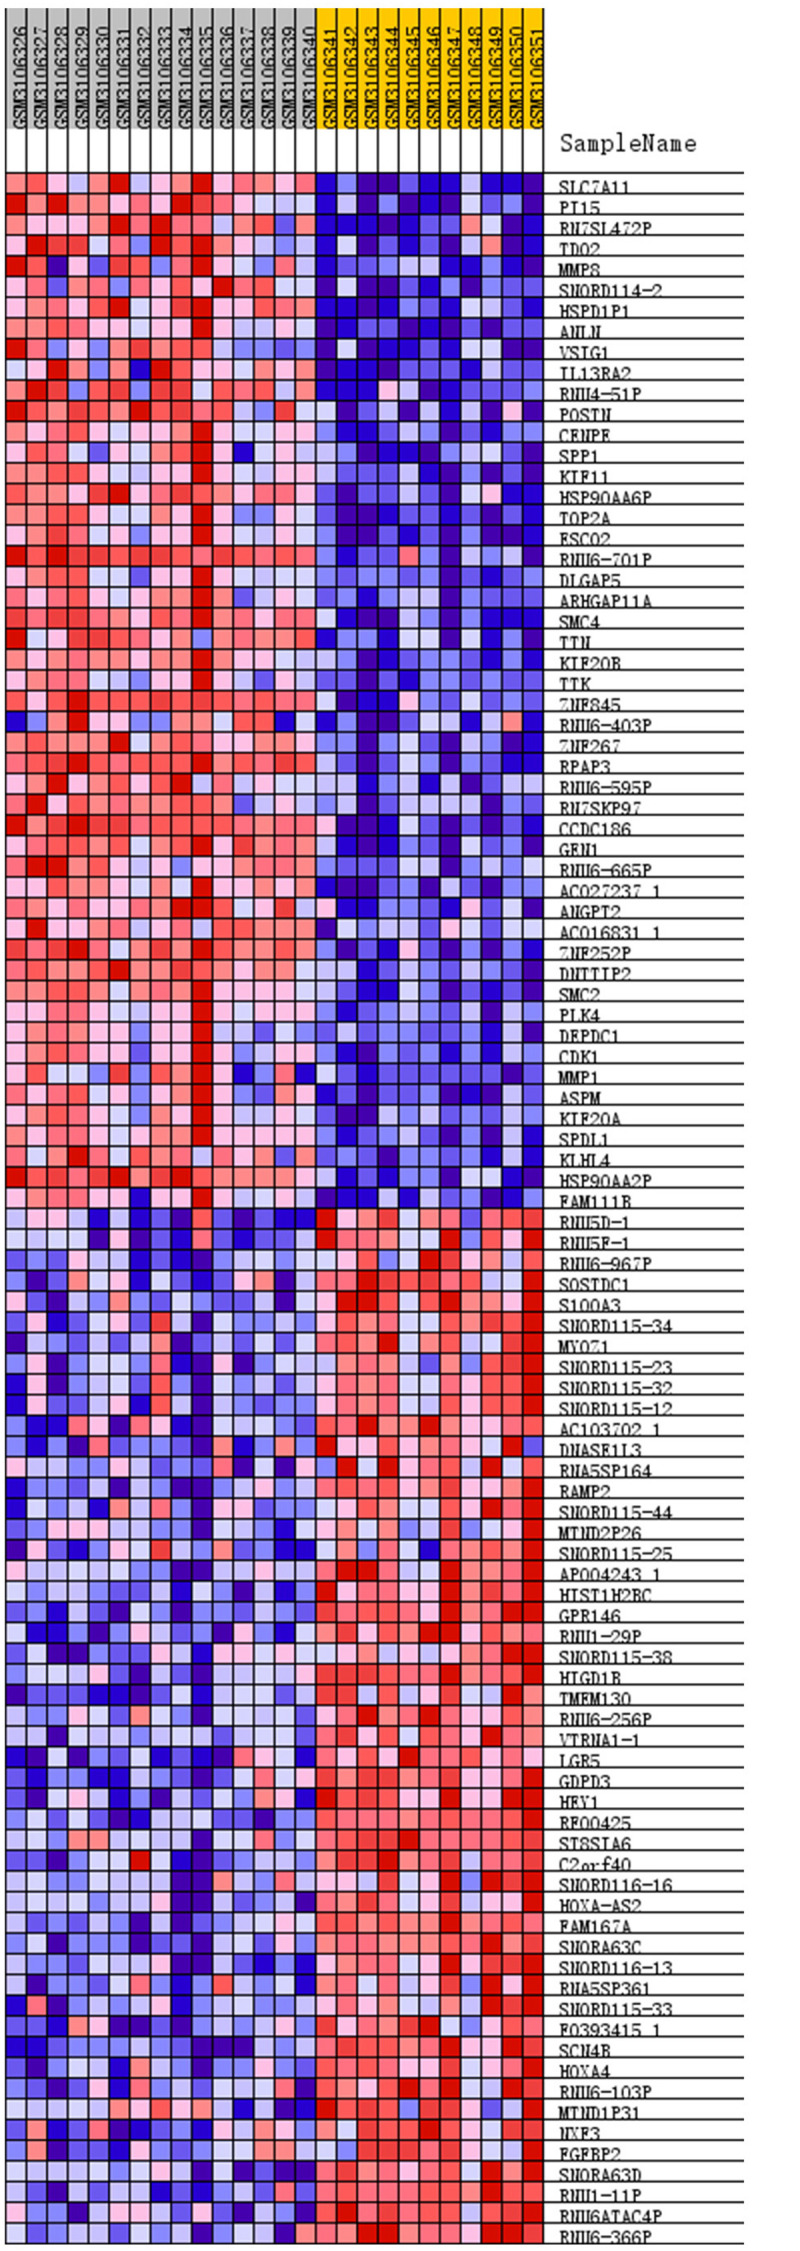
FIGURE 1.

Heatmap of top 50 features for each phenotype. The PAH group: GSM3106326 – GSM3106340, and the normal lung tissue group: GSM3106341 – GSM3106351. Removed duplicate probes in GSE113439 and identified a total of 23,410 genes. Among these, 5,525 genes showed differences in expression between PAH tissues and healthy lung tissues. The expression of 3,964 genes was increased in PAH tissues, while 1,291 genes were upregulated in healthy lung tissues. The heatmap showed the two groups of genes that were in the top 50 for upregulation or downregulation. Red indicates that the gene expression is up-regulated, while blue indicates that the gene expression is down-regulated. In the same color, the darker the color, the more significant it was.
