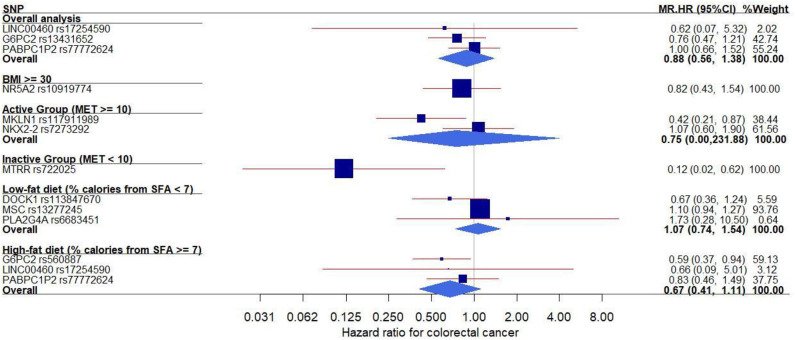
Figure 1.
Forest plot of the MR effects of IR on colorectal cancer risk in the overall and subgroups. For each of non-pleiotropic IR SNPs, the plot shows the effects of genetically driven IR (FG, FI, or HOMA-IR) on colorectal cancer risk in the overall and subgroups, presented as the 95% CIs (indicated with red lines) of the estimates and the inverse-variance weights (percentages proportional to the size of the blue squares). BMI, body mass index; CI, confidence interval; FG, fasting glucose; FI, fasting insulin; HOMA-IR, homeostatic model assessment–insulin resistance; HR, hazard ratio; IR, insulin resistance; MET, metabolic equivalent; MR, Mendelian randomization; SFA, saturated fatty acids; SNP, single–nucleotide polymorphism.

