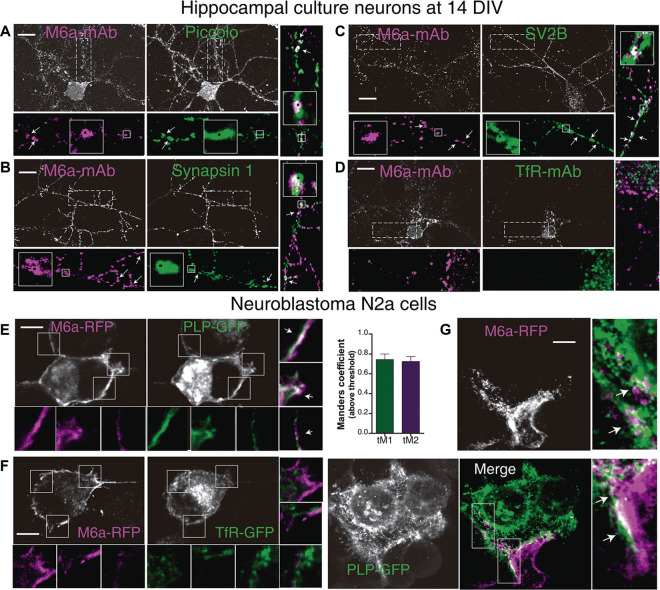
Figure 5.
M6a interacts with synaptic proteins and with major myelin protein, PLP. (A–D) Representative images of primary hippocampal cultured neurons at 14 DIV. Neurons were labeled for endogenous M6a (gray or magenta in the insets) and endogenous piccolo (A), synapsin 1 (B), SV2B (C), and TfR ((D; gray and green in the insets). The magnifications show 25 μm of primary (C,D), secondary (A), and tertiary (A,B) dendrite length. Punta Analyzer plugin of ImageJ was used to measure the colocalization between M6a and synaptic markers. Puncta Analyzer displayed images such as the ones shown here in which colocalization puncta are indicated by black squares (inset). Merged images show clusters of M6a colocalizing with clusters of piccolo (A) or synapsin-1 (B) and SV2B (C; with arrows and black squares). Scale bar: 10 μm. (E,F) Representative images of murine neuroblastoma N2a cells co-transfected with M6a-RFP/PLP-GFP (E) and M6a-RFP/TfR-GFP (F). The insets (5 × 5 μm) show the pattern of distribution of M6a-RFP (magenta) and PLP-GFP or TfR-GFP (green) and the merged images show colocalization between M6a-RFP and PLP-GFP (E, white arrows), but not between M6a-RFP and TfR-GFP. (G) Representative images of co-culture experiment between cells that only expressed PLP-GFP and cells that only expressed M6a-RFP. The magnification (5 × 10 μm) reveals patches of colocalization (white) between both cell surfaces. Scale bar: 5 μm. Confocal images were acquired with a 60× objective on an Olympus FV1000 confocal microscope. The colocalization between M6a and TfR or PLP was measured by the Coloc2 plugin of ImageJ. For those pairs of proteins positive for colocalization (average of Pearson’s coefficient over than 0.5). Mander’s coefficients (M1, green channel and M2, red channel) were measured and plotted (n = 13–25 cells). No positive Pearson’s coefficients of colocalization between endogenous M6a and TfR or M6a-RFP and TfR-GFP were measured.

