FIGURE 1.
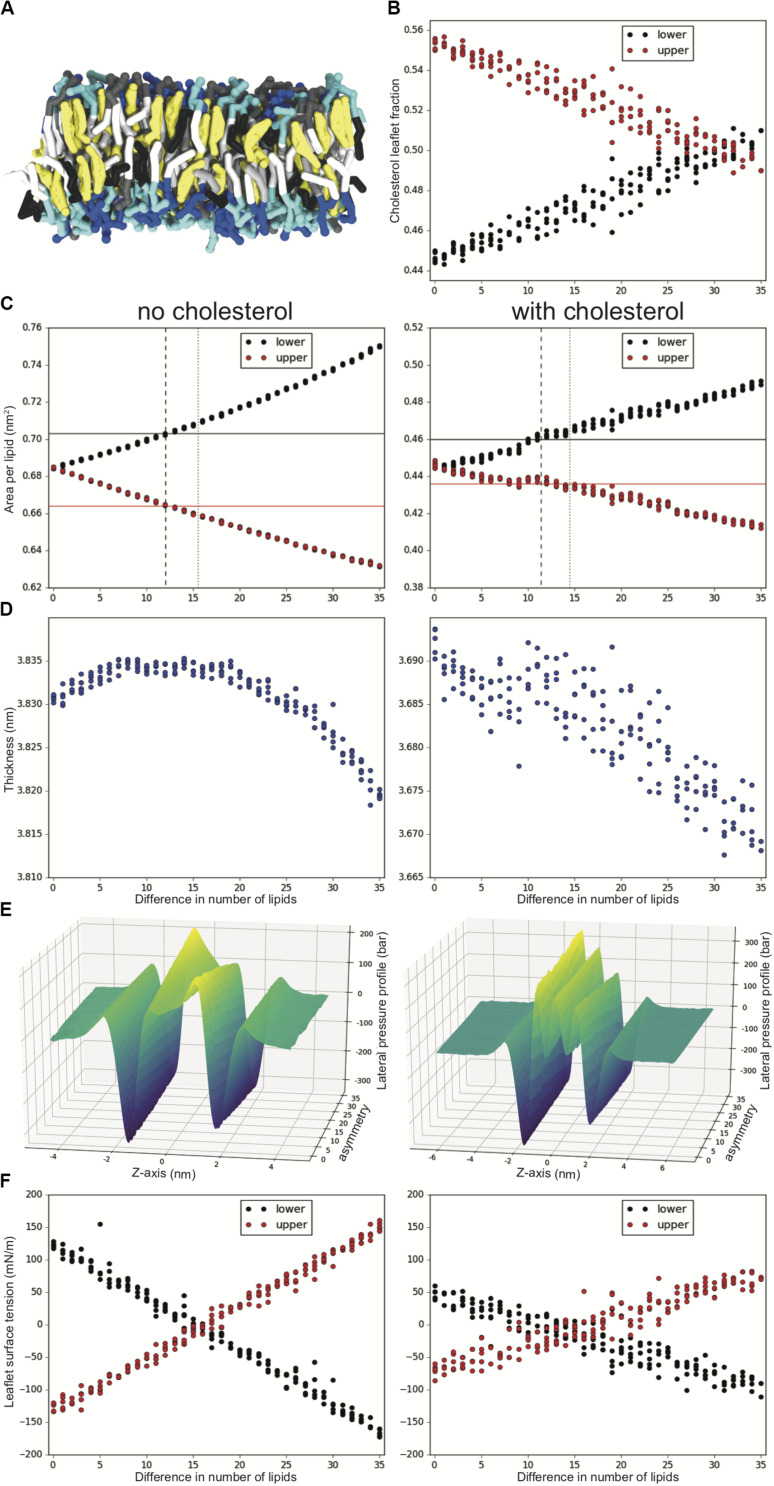
Tuning lipid number asymmetry for an asymmetric DPSM/POPC/PAPE 40:40:20 upper and 10:40:50 lower mixture, with and without 50% cholesterol. (A) Snapshot showing a sideview of a simulation with cholesterol and a difference in number asymmetry of 20 lipids. Tails are colored white, gray and black for 0, 1, and 4 double bonds, cholesterol is yellow and the headgroups are gray, blue and cyan for SM, PC and PE, respectively. (B) Cholesterol fraction in the upper and lower leaflet of each system. (C) Upper and lower leaflet APL for increased lipid number asymmetry. APL for symmetric upper (red) and symmetric lower (black) are shown in solid lines. Suggested number asymmetry value for this mixture from ratio of symmetric simulations and minimal leaflet ST are shown in dashed and dotted lines, respectively. (D) Bilayer thickness. (E) LPPs averaged over repeat simulations and outliers removed (Supplementary Figure S1). (F) Upper and lower leaflet ST. All analysis is averaged over the last 2 ms of the 10 ms simulations and there are 4–5 repeats for each lipid number asymmetry value.

