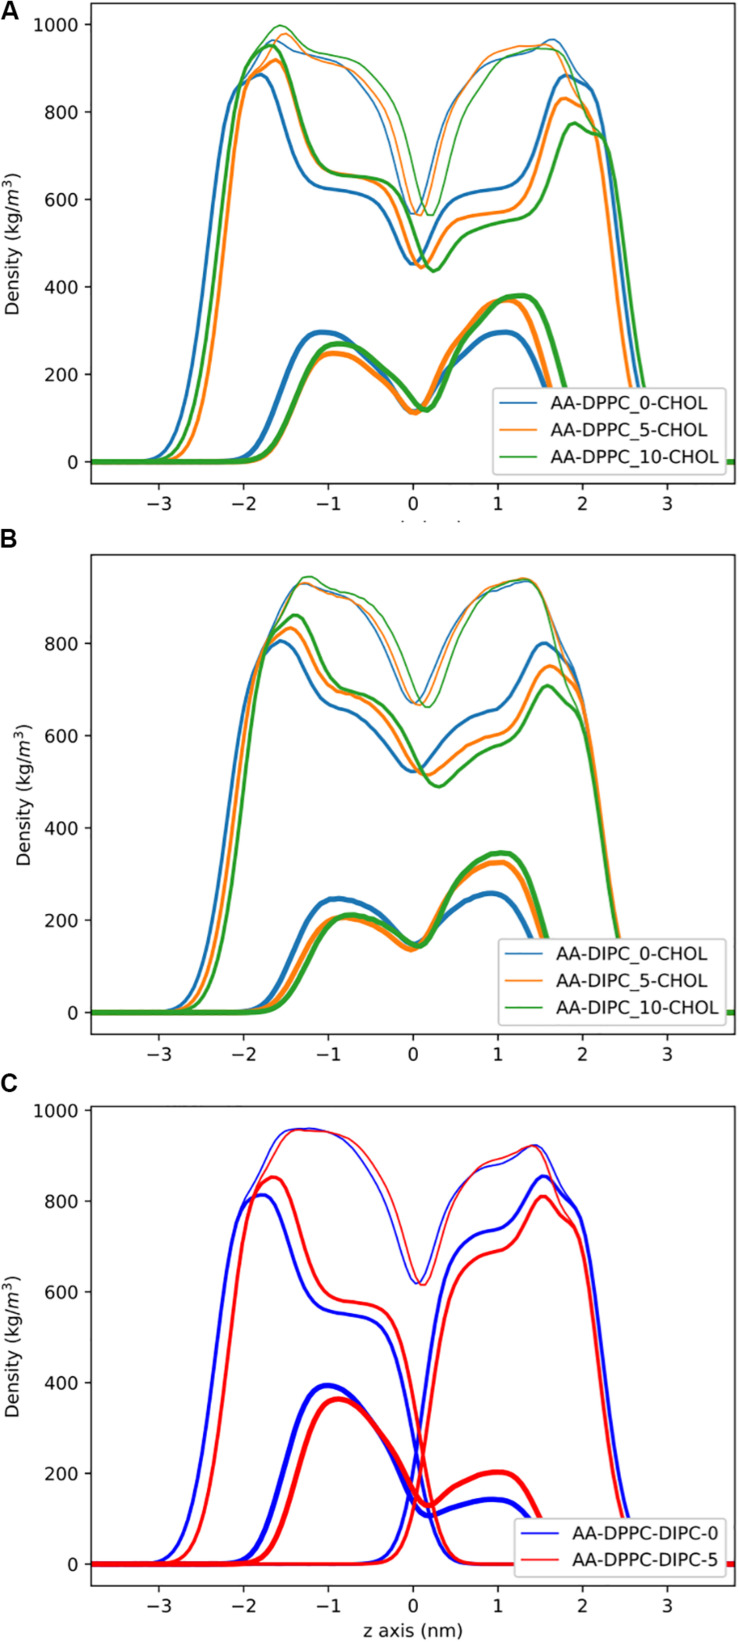
FIGURE 6.
Partial density profiles for the AA lipid bilayers with 30 mol% cholesterol. (A) Profiles for DPPC. (B) Partial densities for DIPC. (C) Bilayers with asymmetric DPPC in one leaflet and DIPC in the other. Thin lines are for the whole bilayer, medium lines are the PC lipids, and cholesterol is thick lines.

