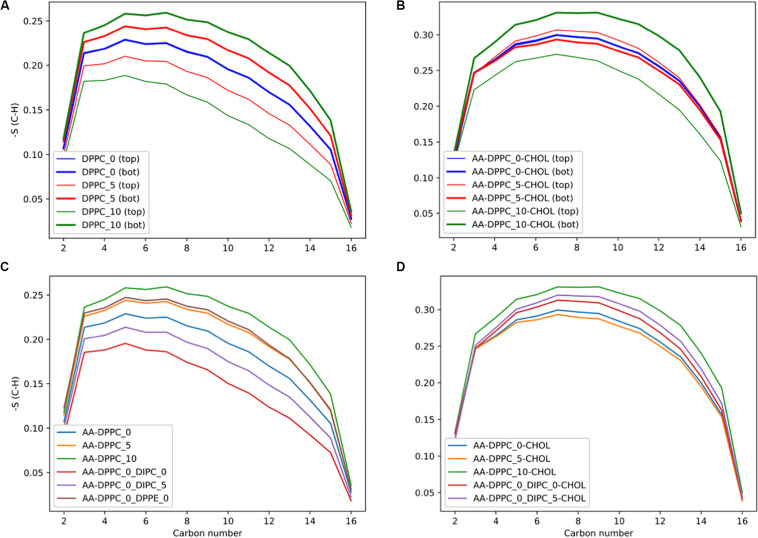
FIGURE 7.
DPPC lipid chain order parameters for the DPPC’s sn-2 chain. (A) Order parameters for the pure DPPC bilayer, comparing the top and bottom leaflets, and (B) with 30 mol% cholesterol. (C) Comparing order parameters for the top leaflet in the different membranes with compositional asymmetry, and (D) with 30 mol% cholesterol.

