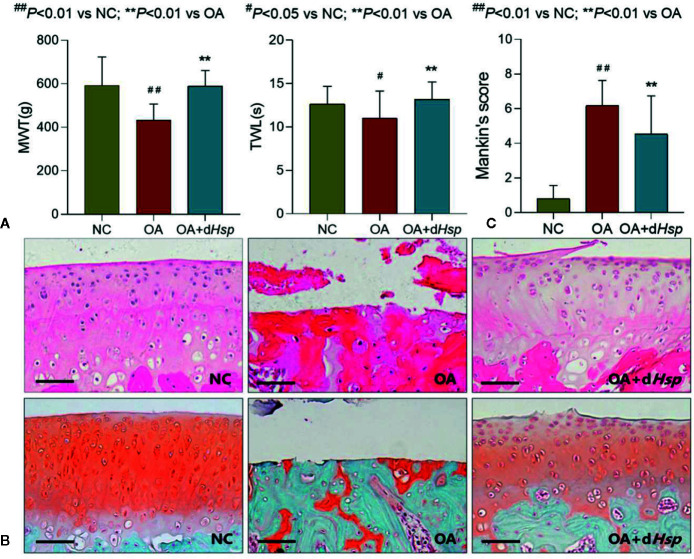
Figure 4.
(A) MWT (g), TWL (s) results of the left and right hind paws of rats tested after final dHsp treatment (28 d); (B) Histopathological observation (HE and Safranin-O staining); (C) Mankin’s scoring of rat knee joints at day 28 after dHsp treatment. Values are presented as mean ± SD. # P < 0.05 vs. NC group; ## P<0.01 vs. NC group; **P<0.01 vs. OA group. Scale bar = 100 μm.

