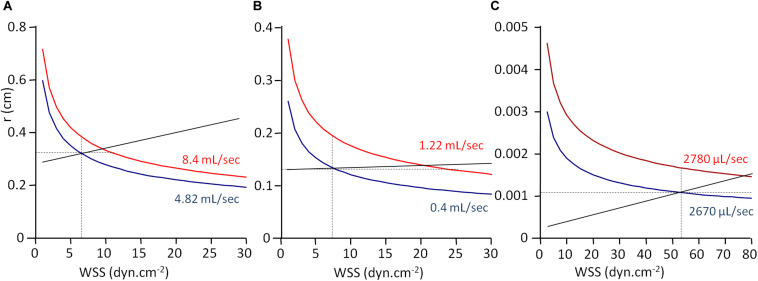
FIGURE 3.
WSS-induced vasoreactivity. Graphical representation of WSS and vessel radius from Table 3 data. r, vessel radius; WSS, wall shear stress. The curves are the graphical representation of the function r = f(WSS) calculated according to Eq. 11. Values for blood viscosity (η), blood flow (Q), r, and WSS are the experimental ones given in Table 3, and the curve is built by varying WSS value and calculating r from the equation. Panels (A), (B), and (C) are the curves built from the data obtained in human common coronary artery (A), human brachial artery (B), and rat cremaster muscle arterioles (C). Full black lines represent WSS sensitivity, the slope of the line being the sensitivity coefficient SWSS. Intercepts of the line with the curves are the observed radius and WSS values. Horizontal and vertical dot lines correspond, respectively, to the absence of WSS sensitivity, and uniform WSS.

