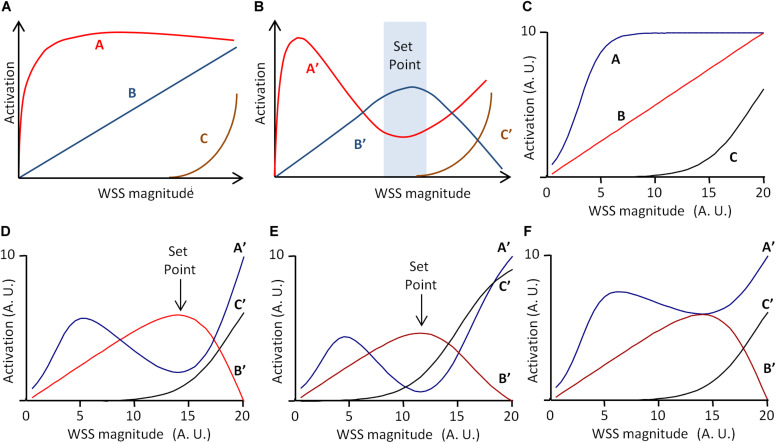
FIGURE 4.
Scheme of the set point model for vascular remodeling. (A,B) Scheme of the dynamic model proposed by Baeyens and Schwartz (2016), redrawn from the original publication. A, B, and C are three WSS-dependent intercellular pathways determining vessel remodeling and quiescence. (A) Independent activation profile of A, B, and C. (B) Activation profile of A, B, and C outputs (A′, B′, and C′, respectively), when C inhibits B, and B inhibits C. If A′ determines inward remodeling, B′ quiescence, and A′C′ outward remodeling, the model predicts a “set point” zone of WSS for which B′ is greater than A′ and C′, corresponding to the quiescent state. (C) Graphical representation of the mathematical formulation of the model (Eqs 12–17) with Am = 10, Cm = 10, α = 3, β = 0.5, γ = 19, ha = 0.4, and hc = 0.2. (D) Model prediction for A′, B′, and C′ for Ic = 100% and Ib = 80%. (E) Model prediction for A′, B′, and C′ for γ = 15 instead of 19. Values are expressed in arbitrary units (A.U.). (F) Model prediction for A′, B′, and C′ for Ib = 40% instead of 80%. Vertical arrows indicate the set point value, defined as maximal B′ value above A′ and C′ values. Values are expressed in arbitrary units (A.U.).

