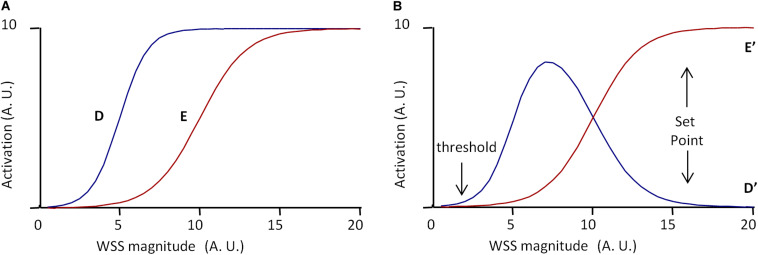
FIGURE 5.
Scheme of the set point model for vessel stabilization. The model is based on two pathways, D and E, defined by Eqs 18–21, E inhibiting D. (A) Independent activation profiles of D and E with Dm = 10, Em = 10, δ= 5, ϵ= 10, hd = 0.5, and hc = 0.3. (B) Predicted activation profiles of D and E outputs (D′ and E′, respectively), for Ie = 100%. Values are expressed in arbitrary units (A.U.). The model predicts a minimal WSS threshold for WSS sensitivity. If D determines cell migration and E cell polarization, and if vessel stabilization is defined by maximal EC polarization and the end of EC migration, the model predicts a set point value for vessel stabilization, cell migration being maximal before the set point value is obtained.

