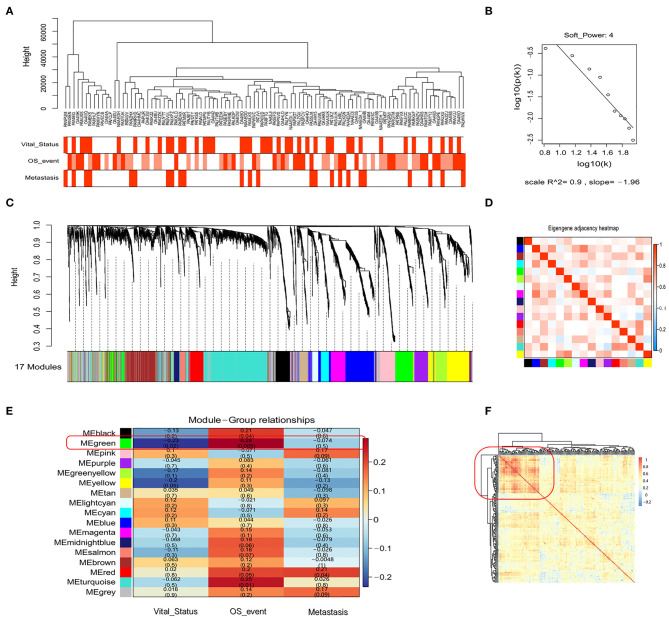
Figure 3.
WGCNA of the genetic modules related to prognosis based on immune-related genes. (A) Sample dendrogram and trait indicator. (B) Checking the scale-free topology for the soft-thresholding power chosen. (C) Cluster dendrogram among patients for 17 modules by immune-related gene expression. (D) Heatmap of eigengene adjacency between individual modules. (E) Heatmap of module–trait relationships. (F) The clustering of genes in the green module based on Spearman's correlation coefficients between samples.

