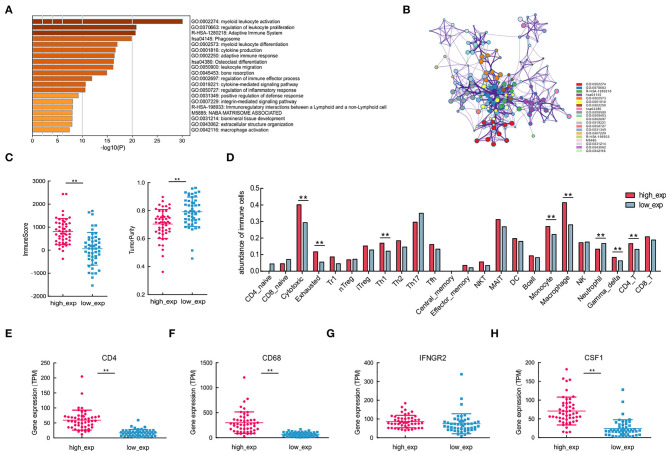
Figure 5.
Immune cells with varying CSF1R expression patterns, associated with different molecular subtypes of CD4 and CD68. (A,B) Enrichment and protein-protein interaction analysis of differentially expressed genes between CSF1R high- and low-expression groups. (C) Comparisons of tumor-infiltrating immune cells and tumor purity depend on CSF1R expression. (D) Comparison of the abundance of 24 immune cells in groups with different CSF1R expression levels. (E–H) Comparison of the expression levels of tumor-infiltrating immune cells with gene signatures CD4, CD68, IFNGR2, and CSF1 between CSF1R high- and low-expression groups in the TARGET cohort. The P value: *p < 0.05; **p < 0.01.

