
FIGURE 3.
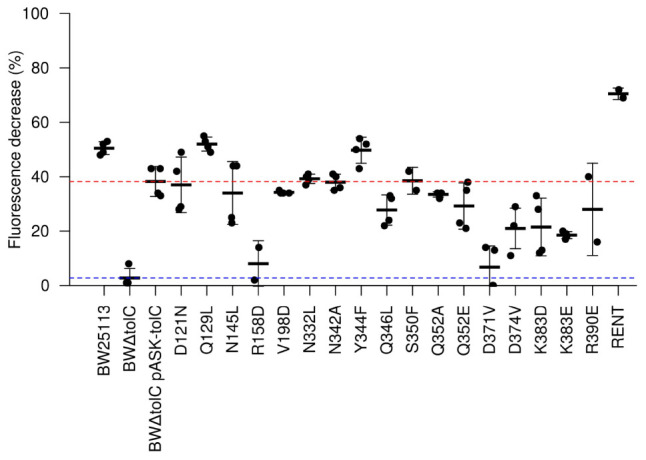
Efflux activity as determined by Nile Red efflux assays. A value of 100 would indicate complete loss of fluorescence. Each dot represents a unique biological replicate; error bars represent standard deviation. Values were normalized first to account for minor differences in OD600 between samples. The red and blue dotted lines represent efflux efficiency of the wild-type TolC positive control and the BWΔtolC negative control, respectively. Note that R158D and D371V show efflux decrease similar to the TolC-deletion control, while “RENT” double-mutant provides statistically significant increase in efflux efficiency.