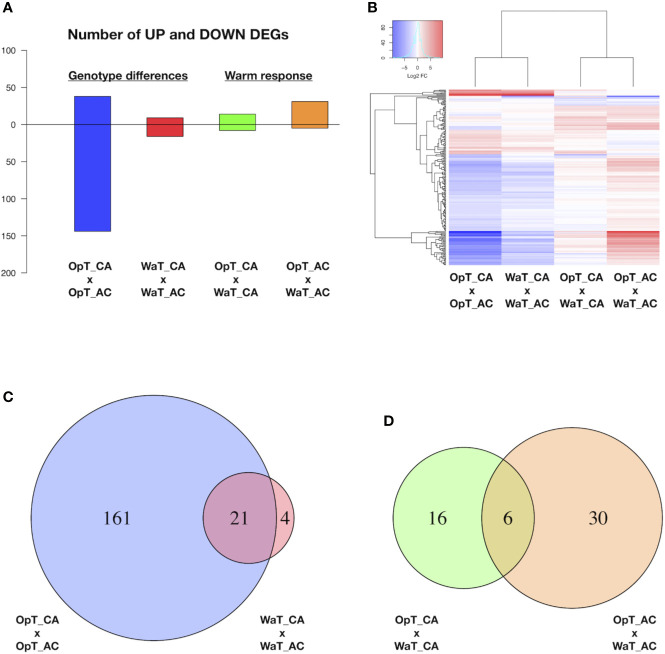
Figure 2.
RNAseq analysis of two coffee genotypes under two temperature conditions. (A) Number of differentially expressed genes (DEGs) between coffee genotypes, cvs. Acauã and Catuaí, at stated temperature (OpT or WaT; named “genotype differences” in figure) and between the same cultivar at different temperatures (named “warm response”). (B) Heat map with up and down-regulated DEGs shown in A. (C) Venn diagram showing the DEGs found between coffee genotypes at OpT and WaT conditions (genotype differences) highlighting that the warm temperature causes a drastic reduction on DEGs. (D) Venn diagram showing the DEGs responsive to WaT for each coffee genotype (warm response). Details of DEGs, including genome identification, annotation and expression analysis, are available in Table S2. Labels: OpT, optimal temperature (23/19°C, day/night); WaT, warm temperature (30/26°C, day/night); CA, cv. Catuaí; AC, cv. Acauã. OpT_CA, WaT_CA, and WaT_AC were composed of five repetitions each, whereas OpT_AC had four repetitions.

