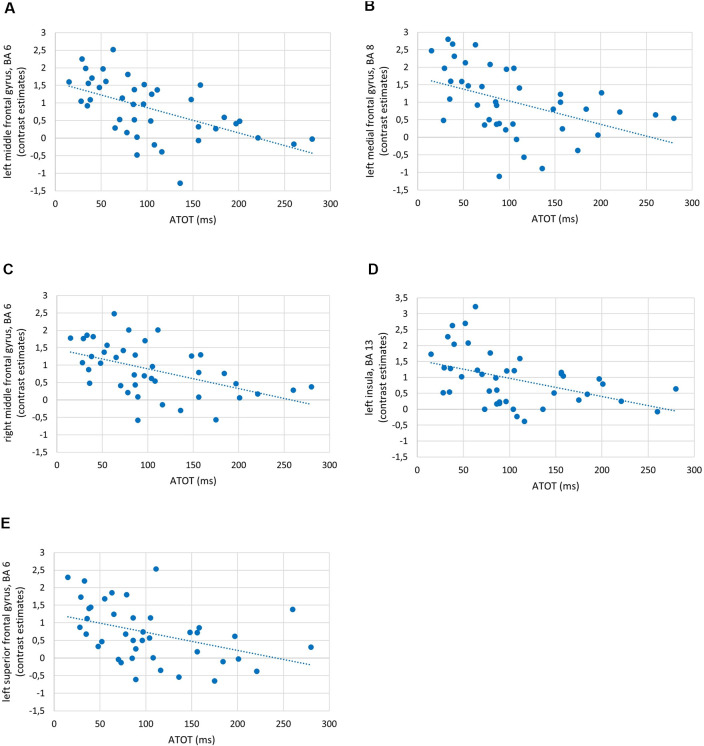
Figure 5.
Examples of correlations between temporal-order threshold (ATOT) values and brain activity in regions of interest (ROIs) with peak level activation in (A) left middle frontal gyrus (MFG), BA 6; (B) left medial frontal gyrus, BA 8; (C) right MFG, BA 6; (D) left insula, BA 13; and (E) left superior frontal gyrus (SFG), BA 6.

