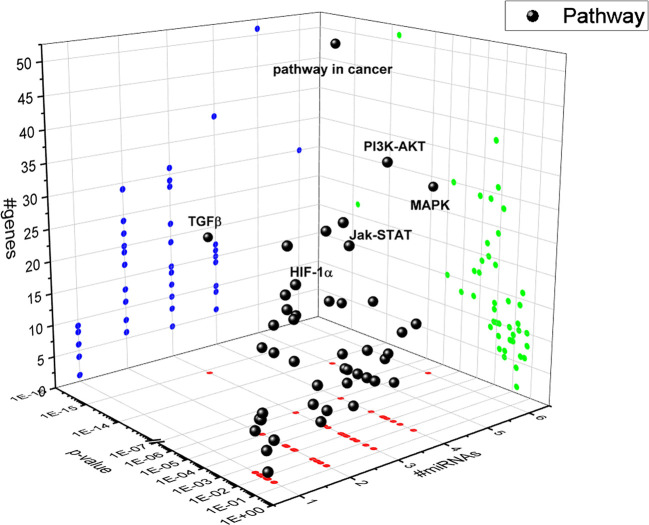
Figure 4.
3D scatter plot of pathways regulated by HypoxamiRs in human retinal endothelial cells (HRECs), challenged with CoCl2. Blue dots represent #gene projection of #miRNAs dimension. Green dots represent p-value projection of #genes dimension. Red dots represent #miRNA projection of p-value dimension.

