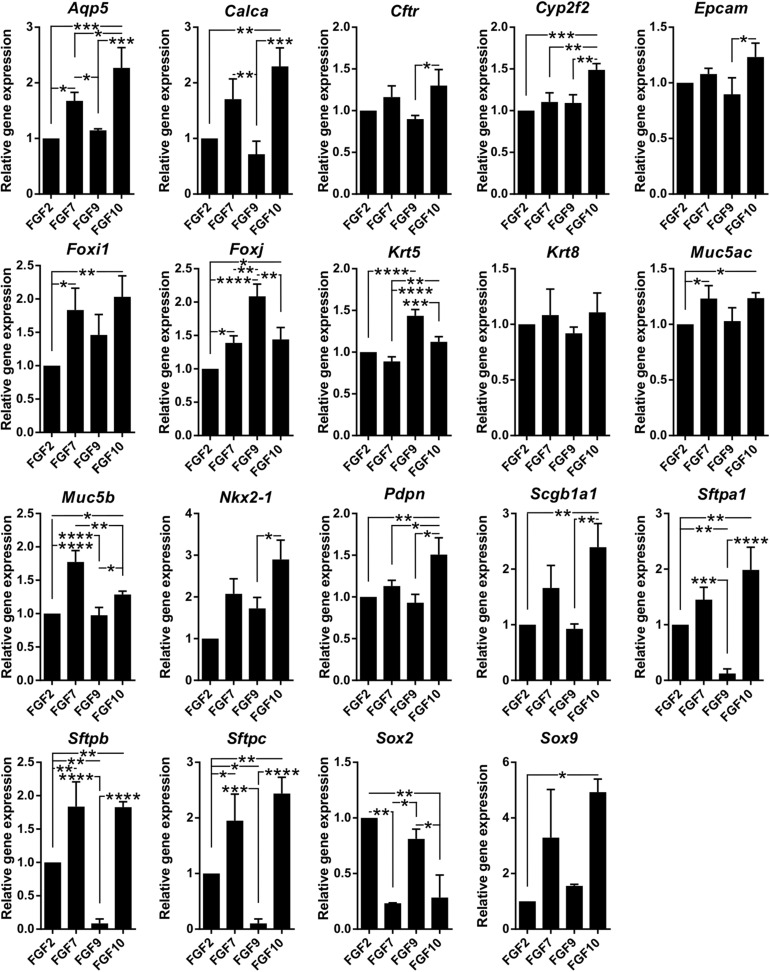
FIGURE 5.
FGF ligands demonstrate differences in promoting certain lung epithelial cell types. Results from qPCR analysis of expression of candidate genes in organoids grown with different FGF ligands (1 nM). The plots show mean + SD, n = 3 (2 for Sox2, Sox9, and Nkx2-1). *P < 0.05; **P < 0.01; ***P < 0.001; ****P < 0.0001 (one-way ANOVA).

