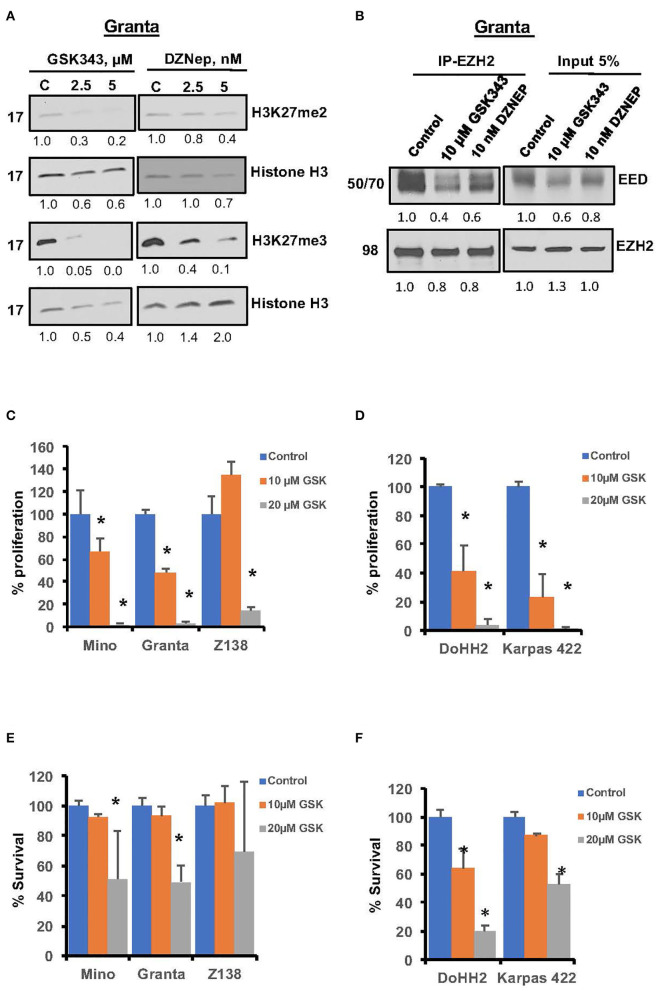
Figure 4.
Effects of pharmacological inhibition of EZH2 on growth and PRC2 integrity in lymphoma cells. (A) Representative western blot images showing H3K27me2 and H3K27me3 in Granta cells treated with GSK343 or DZNep used at indicated concentrations for 48 h, β-Actin and the histone H3 were used as loading controls. The numbers underlining each western blot image represent relative band intensity as compared to the control lane in same blot. (B) Representative images showing levels of EED or EZH2 in proteins immuno-precipitates using either IgG or anti-EZH2 antibody along with 5% input from the lysates of Granta cells treated with EZH2 inhibitors as indicated. (C–F) MCL cell lines (left panel) and FL cells (right panel) were treated with various concentrations of EZH2 inhibitor GSK343 for 72 h. Proliferation (C,D) and survival (E,F) was assessed by thymidine incorporation and Annexin V/PI exclusion, respectively. Bars represent mean ± SD from 3 different experiments (*P < 0.05).

