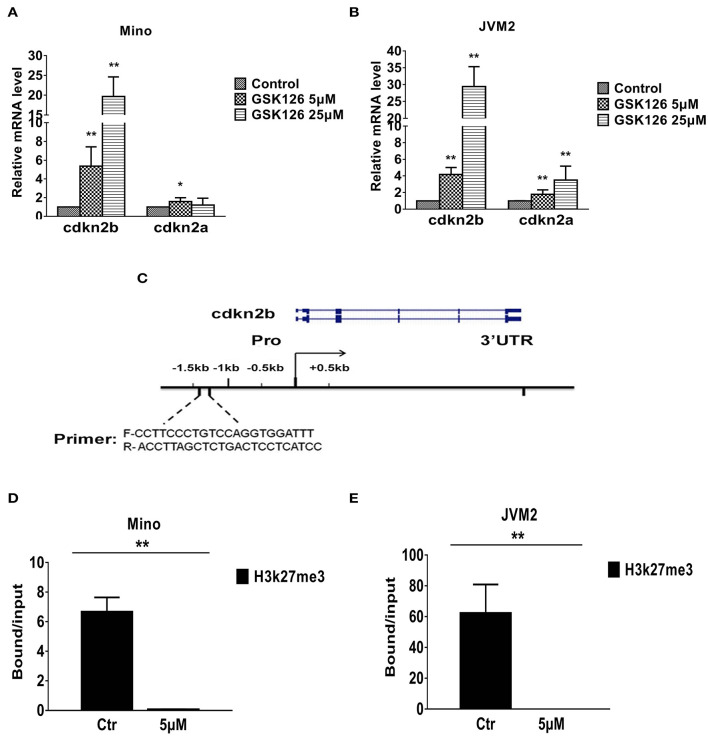
Figure 5.
Effect of EZH2 inhibition on expression of tumor suppressor genes in MCL cell lines. (A,B) Bar graphs showing relative mRNA transcript of cdkn2a and cdkn2b as determined by QRT-PCR in Mino (A) or JVM2 (B) MCL cell lines treated with EZH2 inhibitor for 48 h. (C). Schematic diagram of promoter region of cdkn2b used in ChIP assays, sequence of primers and location of targeted region has been depicted. (D,E) Bar graphs showing fold enrichment of promoter region of cdkn2b gene after ChIP with anti-H3K27me3 antibody as compared to input in Mino (D) or JVM2 (E) cells cultured in absence or presence of GSK126. Bars represent mean ± SD from 3 different experiments, *p < 0.05, and **p < 0.01 for the comparison of cdkn2b amplicon in ChIP with H3K27me3 antibody in control versus GSK126 treated cells.

