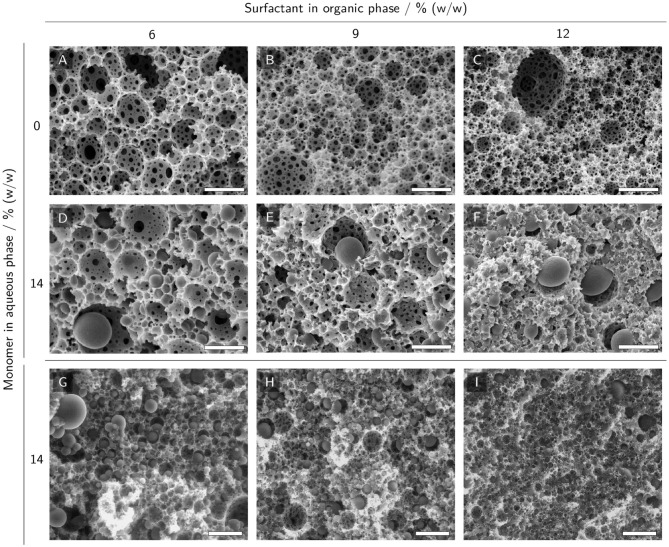
Figure 6.
(E)SEM micrographs of polyHIPE cross-sections with 0% and 14% (w/w) monomer in the aqueous phase and 6% to 12% (w/w) surfactant in the organic phase. (A–C) SEM micrographs of polyHIPEs without monomer in the aqueous phase display a typical polyHIPE morphology with empty voids and interconnecting pores between the voids. (D–F) SEM micrographs of polyHIPEs with monomers in the aqueous phase. (G–I) ESEM micrographs of polyHIPEs with monomers in the aqueous phase. The scale bars represent 10 μm (A–F) and 25 μm (G–I), respectively.

