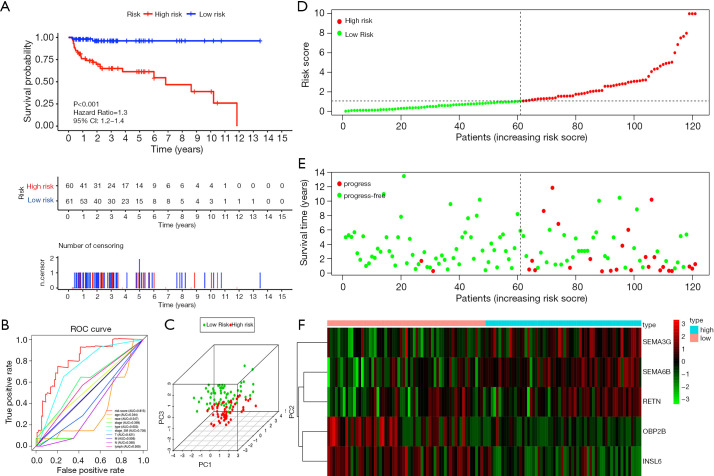
Figure 6.
Prognostic analysis of the entire TCGA cohort. (A) Kaplan-Meier curve analysis of the high-risk and low-risk groups. (B) ROC curve analysis with multiple variables. (C) Principal component analysis. (D) The riskScore distribution of patients in the prognostic model. (E) Survival status scatter plots for patients in the prognostic model. (F) Expression patterns of risk genes in the prognostic model. ROC, receiver operating characteristic curves.

