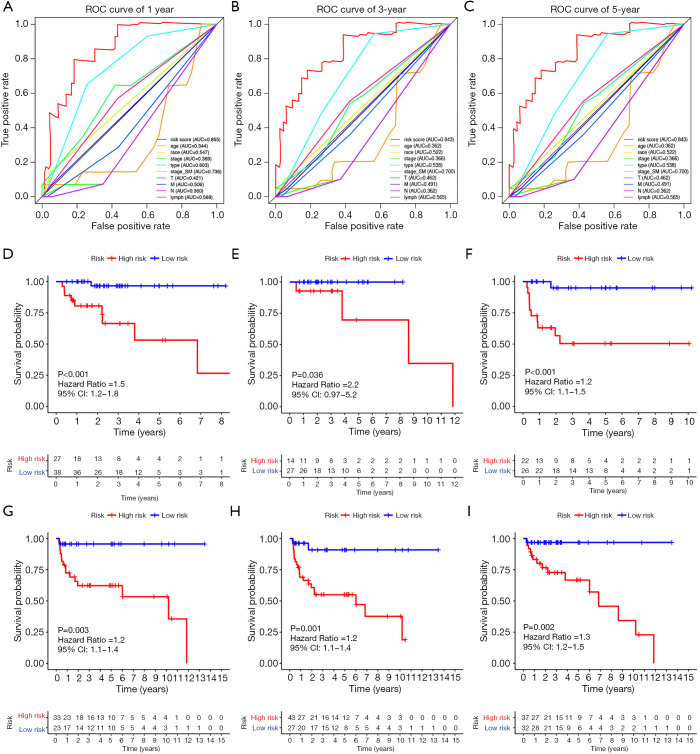
Figure 7.
Prognostic analysis of the entire TCGA cohort. (A) ROC curve analysis with multiple variables for predicting 1-year PFS. (B) ROC curve analysis with multiple variables for predicting 3-year PFS. (C) ROC curve analysis with multiple variables for predicting 5-year PFS. (D) Kaplan-Meier curve analysis in patients with seminoma. (E) Kaplan-Meier curve analysis in patients with normal serum markers (S0). (F) Kaplan-Meier curve analysis in patients without lymphovascular invasion. (G) Kaplan-Meier curve analysis in patients with non-seminoma. (H) Kaplan-Meier curve analysis in patients with abnormal serum markers (S1-3). (I) Kaplan-Meier curve analysis in patients with lymphovascular invasion. ROC, receiver operating characteristic curves.

