Figure S1.
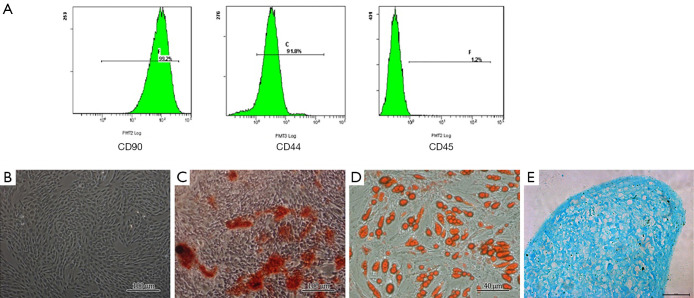
Characterization of rat ADSCs (r-ADSCs). (A) Flow cytometric analysis of r-ADSCs, showing the percentage of CD90+ (99.2%), CD44+ (91.8%), CD45+ (1.2%) cells. Representative image of (B) r-ADSCs under microscopy (scale bar =100 µm); (C) Alizarin red-stained osteocytes 2 weeks after induction (scale bar =100 µm); (D) oil red O-stained adipocytes 3 weeks after induction (scale bar =40 µm); (E) chondrogenesis of adipose derived stem cell, picture shows section after stained with alcian blue (scale bar =50 µm).

