Figure 6.
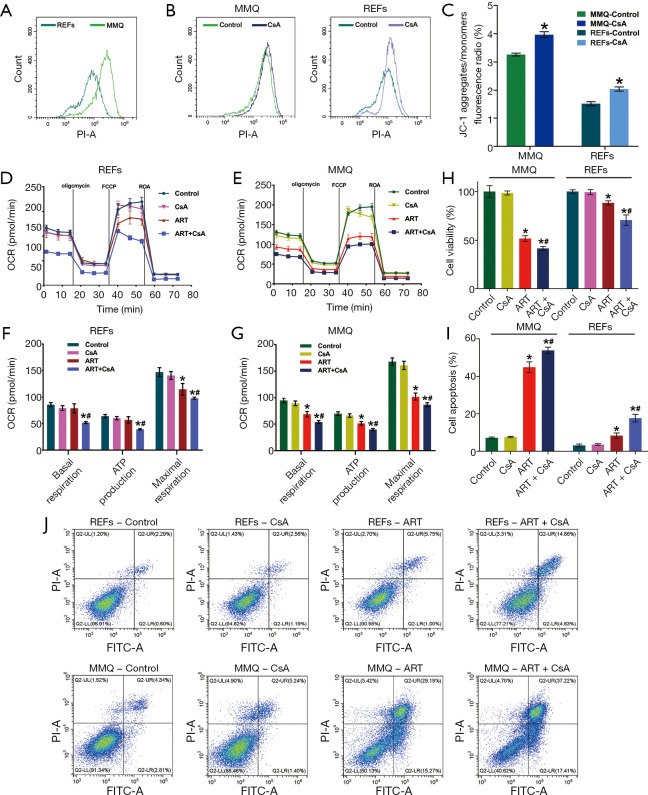
ART effect is associated with high MMP. (A) Count distribution profile of the JC-1 aggregate (PI) of MMQ and REFs without treatment. MMQ mitochondrial membrane potential was higher than that of REFs. (B) Count distribution profile of JC-1 aggregate (PI) and (C) JC-1 aggregate–monomer ratio of MMQ cells and REFs treated with CsA (2 µM, 30 min). CsA treatment improved the MMP of MMQ and REFs (*, P<0.05, vs. control group; mean ± SD, n=3). MMQ cells and REFs were exposed to 8 μM ART, 2 μM CsA, and 8 μM ART combined with 2 μM CsA (ART + CsA) for 12 h. Graphs show the oxygen consumption rate (OCR) measured in (D) REFs and (E) MMQ, and extracted values for basal respiration, ATP-linked respiration, and maximal respiration capacity of (F) REFs and (G) MMQ cells in each group. CsA had no measurable effect on OCR, but in the presence of CsA (2 µM), the ability of ART to inhibit basal respiration, ATP-linked respiration, and maximal respiration capacity was enhanced (*, P<0.05, vs. control group; #, P<0.05, vs. ART group; mean ± SD, n=3). MMQ cells and REFs were exposed to 8 μM ART, 2 μM CsA, and 8 μM ART combined with 2 μM CsA (ART + CsA) for 48 h. (H) Cell viability (%) assay revealed that CsA sensitized MMQ cell and REF toxicity to ART. (*, P<0.05, vs. control group; #, P<0.05, vs. ART group; mean ± SD; n=3). (J) Cell apoptosis fluorescence map and (I) the quantify of cell apoptosis in each group indicated that CsA had no effect in apoptosis, but in the presence of CsA, the proapoptotic activity of ART was enhanced (*, P<0.05, vs. control group; #, P<0.05, vs. ART group; mean ± SD; n=3). ART, artesunate; REF, rat embryonic fibroblasts.

