
Figure 1. SMAD activation induces TP63 expression in bud tip progenitor organoids.
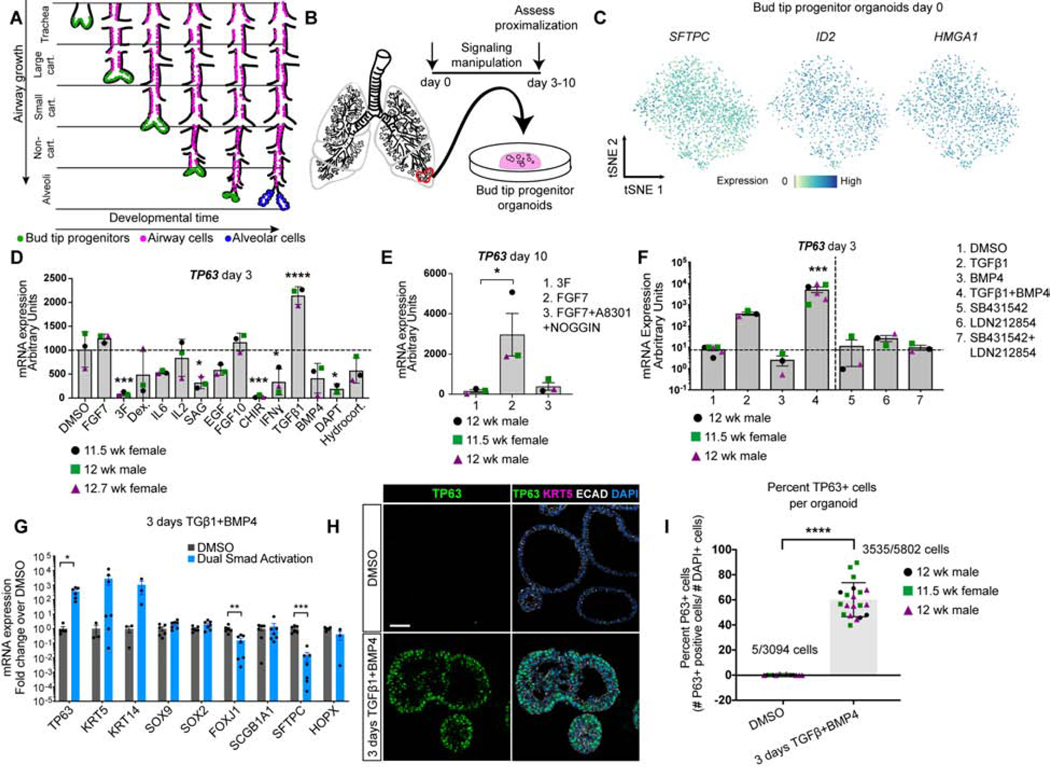
A) Schematic of lung epithelial development. As the airways extend, bud tip progenitors are maintained as progenitors in the tips of branching buds, and leave cells behind that give rise to the intrapulmonary airways. Late in development, remaining bud tip progenitors differentiate into alveolar cells. No bud tip progenitors are present in the adult lung. B) Schematic of creation of epithelium-only bud tip progenitor organoids from 12 week fetal lungs. C) Feature plots for bud tip progenitor marker genes SFTPC, ID2 and HMGA1 from scRNA-seq of day 0 bud tip progenitor organoids maintained for 3 weeks in culture. Additional feature plots from this same data set are shown in Figure 4A. D) mRNA expression by QRT-PCR of basal cell marker TP63 in bud tip progenitor organoids treated for 3 days with serum-free basal medium supplemented with DMSO (control) or with signaling factors known to be important for lung development and cellular differentiation. DMSO (1:1,000 dilution), FGF7 (10 ng/mL), ‘3F’ (FGF7 10ng/mL, CHIR99021 3μM, ATRA 50 nM), Dexamethasone (25 ng/mL), IL6 (10 ng/mL), IL2 (50 U/mL), Smoothened Agonist (SAG; 500 nM), EGF (100 ng/mL), FGF10 (500 ng/mL), CHIR99021 (2 μM), IFNγ (10 ng/mL), TGFβ1 (100 ng/mL), BMP4 (100 ng/mL), DAPT (10 μM), Hydrocortisone (100 ng/mL). Gene expression is reported as arbitrary units. Treatment with TGFβ1 led to a significant increase in the expression of TP63 (one-way Analysis of Variance (ANOVA) (alpha=0.05, p<0.0001, F=14.7. Dunnett’s test of multiple comparison’s compared the mean of each group to the mean of the DMSO control group.) Estimated p values are shown on the graph. Error bars are plotted to show mean +/− the standard error of the mean. N=3 independent biological specimens. Data is from a single experiment. E) Bud tip progenitor organoids were treated with FGF7 (10 ng/mL), a permissive environment for TP63 expression compared to maintenance in bud tip progenitor medium (‘3F’), or with FGF7 (10 ng/mL) plus factors to inhibit SMAD signaling (A8301 [1 μM] and NOGGIN [100 ng/mL]) and TP63 gene expression was evaluated by QRT-PCR after 10 days in culture. A one-way Analysis of Variance was used followed by Tukey’s multiple comparison test to compare the means of each group to the mean of every other group. Estimated p values are reported on the graph. Error bars are plotted to show mean +/− the standard error of the mean. N=3 independent biological specimens. Data is from a single experiment. F) Bud tip progenitor organoids were treated for 3 days with SMAD activation or inhibition conditions and expression of TP63 was evaluated by QRT-PCR for all treatment groups. All media contained 3F components (FGF7 10ng/mL, CHIR99021 3μM, ATRA 50 nM), with individual groups containing combinations of: DMSO (1:1000 dilution), TGFβ1 (100 ng/mL), BMP4 (100 ng/mL), SB431542 (10 μM), LDN212854 (200 nM). One-way ANOVA alpha=0.05, F=21.19, p<0.0001; Tukey’s multiple comparisons of the mean of each group versus the mean in all other groups, estimated p values are reported on the graph. 3 days TGFβ1 and BMP4 is referred to as ‘dual SMAD activation’, or ‘DSA’. Data is plotted as arbitrary units. Error bars are plotted to show mean +/− the standard error of the mean. N=3 independent biological specimens. Data is from a single experiment and is representative of n=3 experiments. G) QRT-PCR for markers of canonical differentiated lung epithelial cell types showing DMSO (gray bars) and DSA treated (blue bars) organoids after 3 total days of treatment. Data is plotted as fold change over DMSO controls. Two-sided Mann-Whitney Tests were performed to compare the mean of the DMSO group to the Dual Smad Activation group (alpha=0.05). Error bars represent the mean +/− the standard error of the mean. n=3 independent biological specimens, and data is from a single experiment and is representative of n=3 experiments. H) Protein staining of DMSO treated (control) fetal bud tip progenitor organoids (top row) and 3 days of DSA treatment (bottom row) for TP63+ protein (green), KRT5 (pink) and DAPI (blue). Scale bar represents 50 μm. I) Quantification of (g). Total number of TP63+ cells were counted for 3–9 individual organoids across 3 biological replicates. n=3 independent biological specimens. A two-sided Mann Whitney test (alpha=0.05) was used to compare the means of each sample. For all graphs, p values are reported as follows: * p<0.05; ** p<0.01, *** p<0.001, **** p<0.0001.