
Figure 1. The mitochondrial elongation complex trapped in two states.
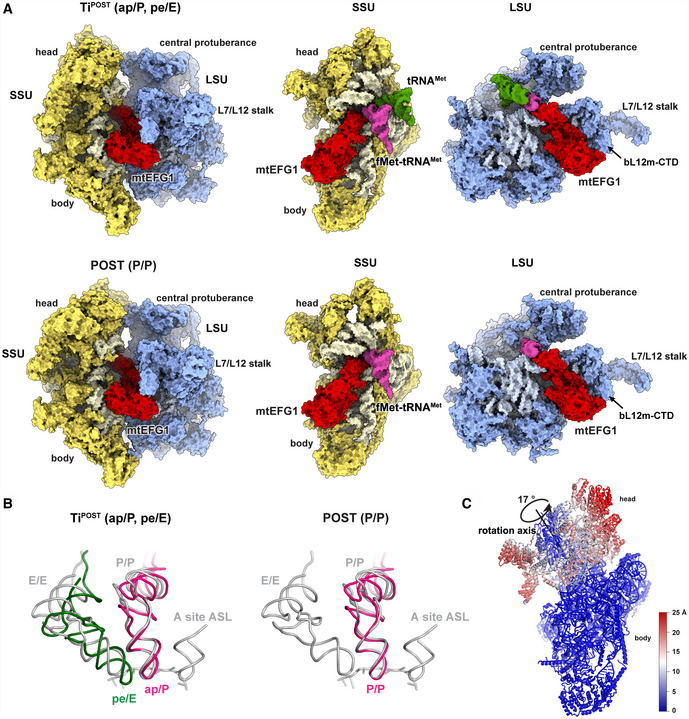
- Structures of mtEFG1 (red), aminoacylated fMet‐tRNAMet (pink), and deacylated tRNAMet (green) with the 55S mitoribsome in TiPOST and POST states. Separate views for SSU and LSU as seen from the subunit interface are shown for clarity.
- The tRNA orientations of TiPOST and POST are depicted in comparison with published classical tRNA positions (gray) after superposition of the LSU (Selmer et al, 2006). The aminoacylated fMet‐tRNAMet is colored in pink and the deacylated tRNAMet in green.
- The degree of head rotation comparing the TiPOST and POST complex is shown with the respective rotation axis and angle calculated in PyMOL using the draw_rotation_axis.py script (P.G. Calvo). The resulting displacement in Å is color‐coded.