
Figure EV4. Overview of the GAC in the mitochondrial elongation and initiation complexes.
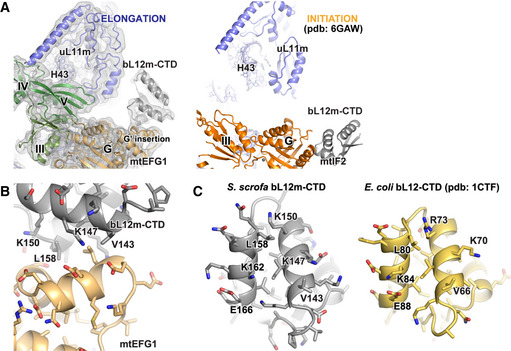
- 16S rRNA of the LSU in the initiation and elongation complexes has been superimposed to enable a direct comparison of both complexes using the exactly same view. The different interaction sites of the bL12m‐CTD on mtEFG1 (color‐coded according to Fig 2D) and mtIF2 (orange) are visible. Moreover, it becomes apparent that mtEFG1 engages in a close interaction with H43 of 16S rRNA as well as uL11m, leading to a downward motion of these elements onto the factor. In contrast, mtIF2 does not contact these elements in the initiation complex.
- A Phyre2 model of the bL12m‐CTD has been rigid‐body fitted into the EM density of the POST state. The interaction site of the bL12m‐CTD (gray) with the G′ insertion of the G domain of mtEFG1 is shown (light orange).
- For comparison, the interfaces of bL12m‐CTD (S. scrofa, gray) and bL12‐CTD (E. coli, yellow, pdb: 1CTF Leijonmarck & Liljas, 1987) that contact the mitochondrial or bacterial elongation factor, respectively, are shown. Key residues for interaction with the G domain of translational GTPases are conserved.