
Figure EV5. Map evaluation.
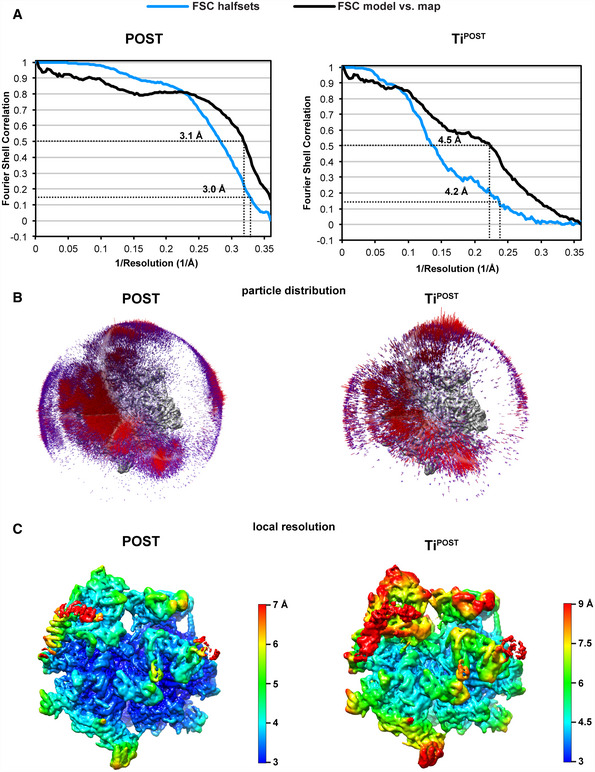
- FSC curves of the halfsets and model versus map for both states are shown with the dashed lines indicating the respective resolution estimates at 0.143 and 0.5 FSC. Curves are plotted until Nyquist (2.78 Å or 0.36 Å−1).
- The particle distribution in the final reconstructions is shown superimposed onto the corresponding EM densities.
- Local resolution estimation was done using the implemented algorithm in RELION 3.1 and has been plotted onto unpostprocessed maps for both states (Zivanov et al, 2018).