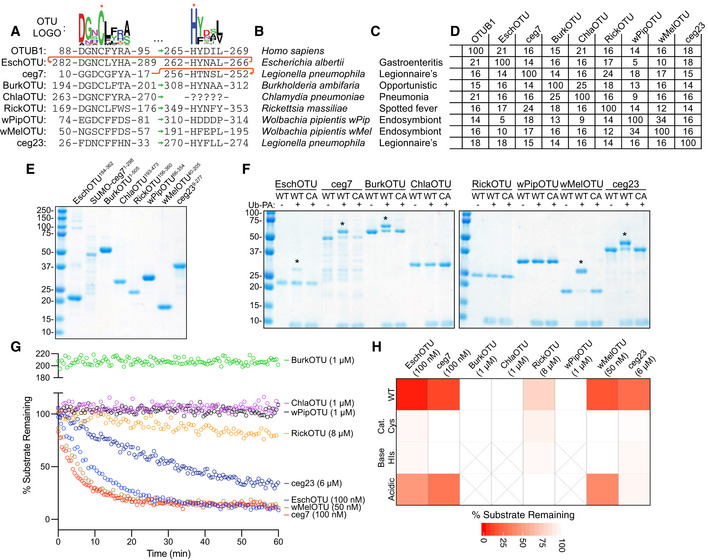
Figure 1. Prediction and validation of OTU DUBs from bacteria.

-
APfam‐generated sequence logo of the regions surrounding the OTU catalytic Cys and general base His (marked with asterisks). The conservation of these regions in the human OTUB1 and predicted bacterial OTUs are shown below, together with their relative order in the sequence topology indicated by the sequence position as well as green and red arrows for the typical and atypical arrangements, respectively.
-
BBacterial species to which the predicted OTUs belong.
-
COutcome of interactions between the highlighted bacterial species and their respective eukaryotic hosts.
-
DPercent identity matrix calculated from a PSI‐Coffee alignment (Notredame et al, 2000) of the predicted OTU domains. OTUB1 (80–271), EschOTU (184–362), ceg7 (1–298), BurkOTU (186–315), ChlaOTU (193–473), RickOTU (161–356), wPipOTU (66–354), wMelOTU (40–205), and ceg23 (9–277) were used to create the alignment.
-
ECoomassie‐stained SDS–PAGE gel showing purified protein from the predicted bacterial OTU constructs.
-
FUb‐PA activity‐based probe assay for wild‐type (WT) and catalytic Cys‐to‐Ala mutants (CA). Strong, Cys‐dependent reactivity is indicated with asterisks.
-
GUb‐KG(TAMRA) cleavage assay monitored by fluorescence polarization at the indicated DUB concentrations. Note that BurkOTU displays an increase in fluorescence polarization, indicative of noncovalent binding.
-
HHeatmap representation of DUB activity against the Ub‐KG(TAMRA) substrate shown in (G), including the WT enzyme and Ala substitutions at the predicted catalytic Cys, general base His, or acidic position. Substrate remaining at the end of the assay is reported after correction against an initial reading from an equivalent assay performed with the catalytically inactive CA mutants.
