-
A
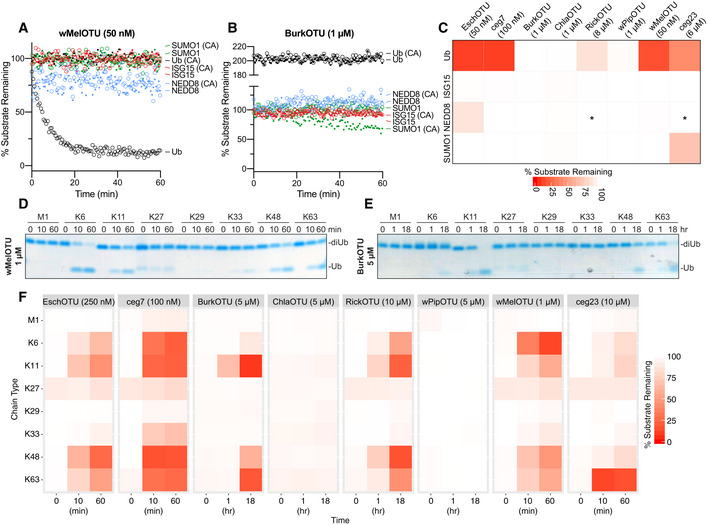
Ub/Ub‐like specificity assay measuring activity of WT and inactive Cys‐to‐Ala wMelOTU toward the Ub‐, ISG15‐, NEDD8‐, and SUMO1‐KG(TAMRA) substrates.
-
B
Ub/Ub‐like specificity assay measuring activity of WT and inactive Cys‐to‐Ala BurkOTU toward the Ub‐, ISG15‐, NEDD8‐, and SUMO1‐KG(TAMRA) substrates. Note that the rise in fluorescence polarization signal, indicative of a noncovalent interaction, is specific to the Ub substrate.
-
C
Heatmap representation of corrected OTU activities toward the Ub and Ub‐like fluorescent substrates. In the reactions marked by an asterisk, an unusually high level of noise in fluorescence polarization signal was observed, likely a result of high OTU concentration.
-
D
Ub chain specificity assay measuring wMelOTU activity toward the eight diUb linkages. Reaction samples were quenched at the indicated timepoints, resolved by SDS–PAGE, and visualized by Coomassie staining.
-
E
Ub chain specificity assay measuring BurkOTU activity toward the eight diUb linkages. Reaction samples were quenched at the indicated timepoints, resolved by SDS–PAGE, and visualized by Coomassie staining.
-
F
Heatmap representation of WT bacterial OTU activities toward the eight diUb linkages at the indicated timepoints.

