-
A
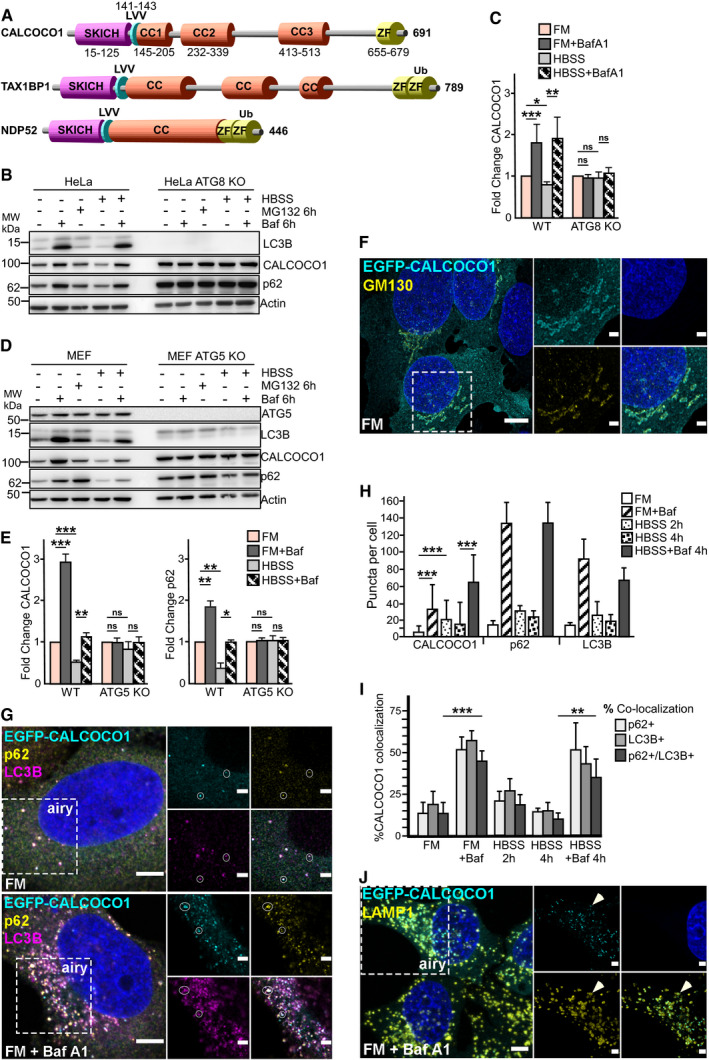
Domain architecture of CALCOCO paralogs showing the SKICH domain, a conserved LIR motif (LVV), coiled‐coli regions (CC), and zinc finger domains (ZF).
-
B–E
Immunoblot analysis of indicated cell lines, starved for 6 h (HBSS) as indicated, and treated with 25 μM MG132 or 200 ng/ml of bafilomycin A1 (Baf A1) for the indicated times. In (C, E), endogenous CALCOCO1 is analyzed and the bars represent the mean ± SD of band intensities relative to the actin loading control, as quantified using ImageJ of three independent experiments. Statistical comparison was analyzed by one‐way ANOVA followed by Tukey multiple comparison test and significance displayed as ***P ˂ 0.001, **P ˂ 0.005, *P ˂ 0.01; ns is not significant.
-
F
A representative micrograph using widefield and deconvolution microscopy of HeLa CALCOCO1 KO cells stably expressing EGFP‐CALCOCO1 and immunostained for endogenous GM130. Scale bars are 5 and 2 μm (zoomed inset).
-
G
Same cells as in (E) were left untreated or treated with Baf A1 for 6 h and then immunostained for endogenous p62 and LC3B. Scale bars are 5 μm for the confocal microscopy images and 2 μm for the airyscans.
-
H
CALCOCO1, p62, and LC3B puncta in the indicated conditions, counted using an automated system. The error bars represent mean ± SEM of puncta per cell of three independent experiments per condition and 250 cells per experiment. Statistical comparison was analyzed by one‐way ANOVA followed by Tukey multiple comparison test. Significance is displayed as ***P < 0.001.
-
I
Percentage of co‐localization of CALCOCO1 puncta with p62 and/or LC3B in cells treated as indicated. The error bars represent mean ± SEM of three independent experiments per condition and over 250 cells per experiment. Statistical comparison was analyzed by one‐way ANOVA followed by Tukey multiple comparison test. Significance is displayed as ***P < 0.001.
-
J
HeLa CALCOCO1 KO cells stably expressing EGFP‐CALCOCO1 were treated with Baf A1 for 6 h and immunostained for endogenous LAMP1. Scale bars are 5 μm for the confocal microscopy images and 2 μm for the airyscans.

