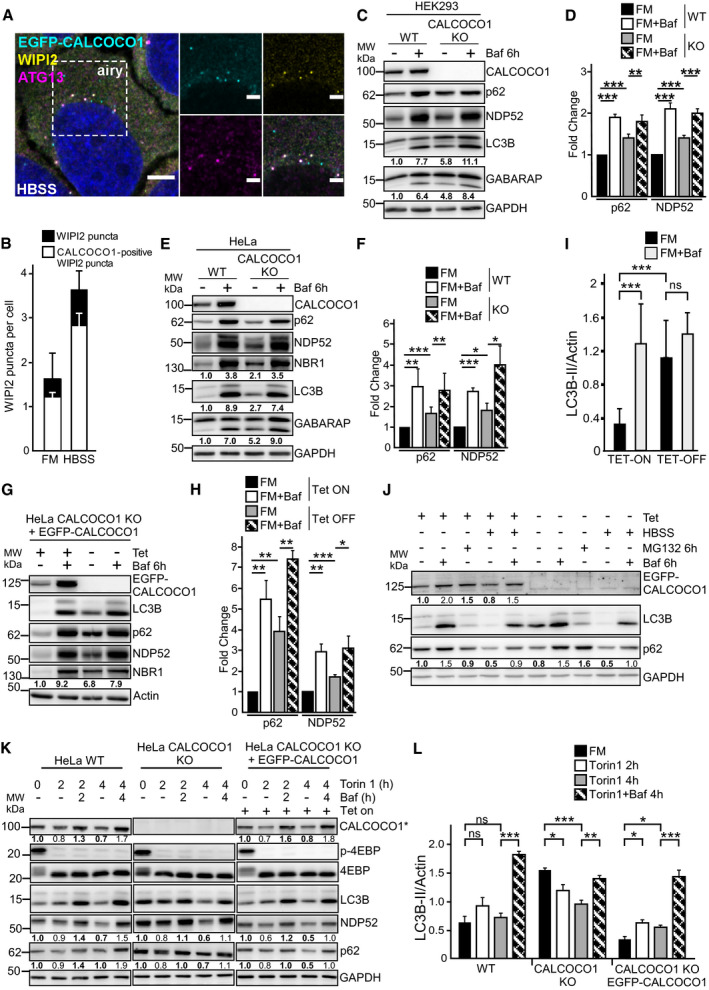
Figure 4. CALCOCO1 promotes basal autophagic flux but not bulk autophagy.

-
A, BHeLa CALCOCO1 KO cells stably expressing EGFP‐CALCOCO1 were starved for 4 h and then immunostained with anti‐ATG13 and anti‐WIPI2 antibodies. Scale bars in (A) are 5 μm for the confocal microscopy images and 2 μm for the airyscans. In (B), the error bars represent mean ± SD of puncta per cell from three independent experiments and 100–200 cells per each experiment.
-
C–LImmunoblot analysis of indicated cell lines treated as indicated. Numbers below the blots represent relative intensity of the bands in the shown blots normalized against the loading control (GAPDH or actin). The asterisk in (K) indicates that endogenous CALCOCO1 is detected in WT and KO cell extracts and EGFP‐CALCOCO1 in cells extracts from the rescued cells. In (D, F, H, I, and L), the bars represent the mean ± SD of band intensities relative to the actin or GAPDH loading control as quantified using ImageJ, n = 5 in (I), n = 3 in others. Statistical comparison was analyzed by one‐way ANOVA and significance displayed as ***P ˂ 0.001, **P ˂ 0.005, *P ˂ 0.01; ns is not significant.
