
Figure EV2. Cx3cr1‐Rheb1 Δ/Δ mice display inhibition of mTORC1 signalling in GL261 TAM.
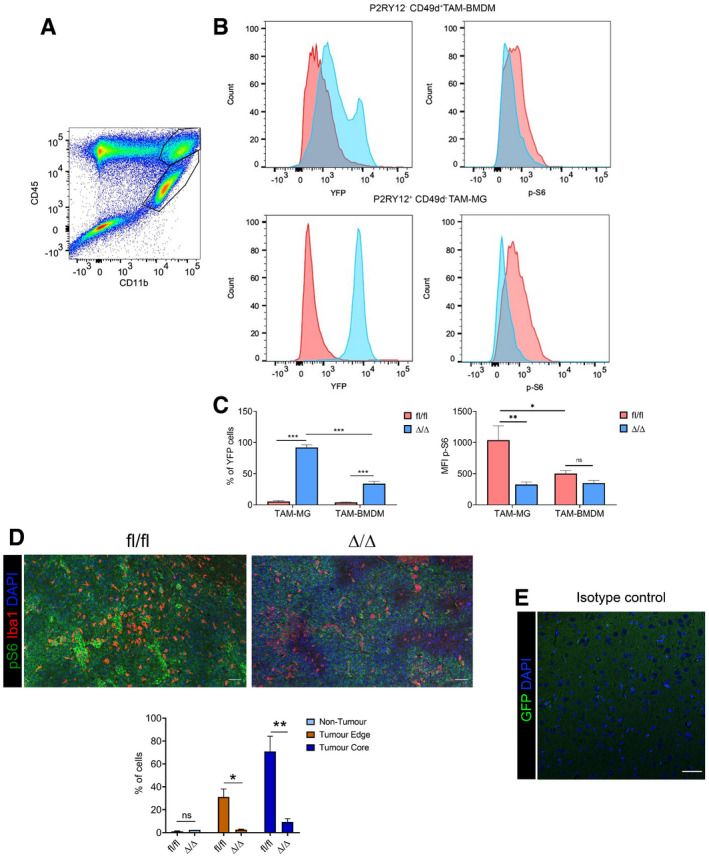
- Representative flow cytometry plot for the expression of CD45 and CD11b in GL261 tumour, with CD45high CD11b+ TAM‐BMDM (top gate) and CD45low CD11b+ TAM‐MG (lower gate).
- Representative flow cytometry plot of YFP (left) and p‐S6 (right) levels in TAM‐BMDM (top) and TAM‐MG (bottom) in Cx3cr1‐Rheb1 Δ/Δ (blue) versus Rheb1 fl/fl (red) GL261 tumours.
- Percentage of TAM‐MG and TAM‐BMDM expressing YFP in Cx3cr1‐Rheb1 Δ/Δ (n = 6) and Rheb1 fl/fl (n = 6) mice. MFI levels of p‐S6 in P2RY12+ CD49d− TAM‐MG and P2RY12− CD49d+ TAM‐BMDM in Rheb1 fl/fl (n = 6) compared to Cx3cr1‐Rheb1 Δ/Δ (n = 6) GL261 tumours (mean ± SEM; two‐way ANOVA Tukey test).
- Staining for Iba1, p‐S6 and DAPI in Rheb1 fl/fl (n = 3) and Cx3cr1‐Rheb1 Δ/Δ (n = 2) tumour tissue (top) and percentage of Iba1+ cells co‐expressing p‐S6 in the three defined regions (bottom) (mean ± SEM; two‐way ANOVA Tukey test). Scale bar is 100 μm.
- Isotype control stain demonstrating quenching of fluorescence from reporter gene (scale bar 50 μm).