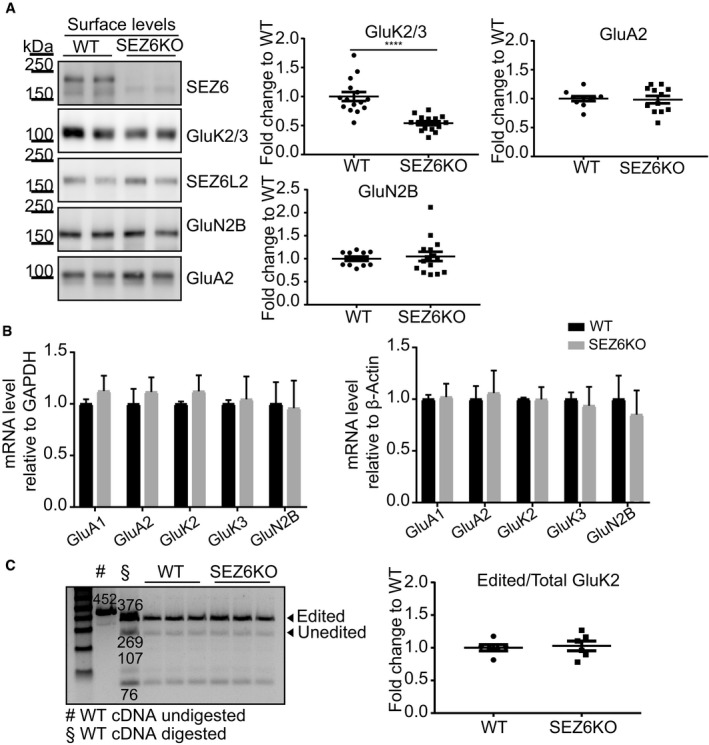
Figure 2. Validation of GluK2/3 reduction on the surface of SEZ6KO neurons by immunoblot.

-
ASEZ6KO and WT neurons were biotinylated with Sulfo‐NHS‐Biotin, and surface proteins were enriched by streptavidin bead pull‐down. The GluK2/3 antibody cannot discriminate the subunits 2 and 3 (Lerma & Marques, 2013); therefore, the band is commonly indicated with the labeling GluK2/3. GluK2/3, GluA2, and GluN2B surface levels were quantified, normalized to SEZ6L2 surface levels (negative control) in the same sample (GluK2/3/SEZ6L2) and divided by the WT levels, with the ratio for WT being set to 1.0 (plot shows mean ± SEM, at least 10 replicates in 4 independent biological experiments, Mann–Whitney ****P‐value < 0.005).
-
BmRNA levels of GluA1, GluA2, GluK2, GluK3, and GluN2B were quantified in SEZ6KO neurons, normalized to GAPDH and β‐actin mRNA in the same sample and compared to the mRNA levels in WT neurons. No difference in GluK2/3 mRNA was detected in SEZ6KO neurons compared to WT (plot shows mean ± SD, 6 replicates in 2 independent biological experiments, multiple t‐test was used).
-
CEditing of GluK2 mRNA was tested in SEZ6KO and WT neurons. The editing value was calculated as (intensity of 376 [edited]/intensity of [376 (edited) + 269 (unedited)]) × 100 and normalized to the band at 76 bp. No difference was detected in SEZ6KO neurons compared to WT (plot shows mean ± SEM, 6 replicates in 2 independent biological experiments, Mann–Whitney test was used).
Source data are available online for this figure.
