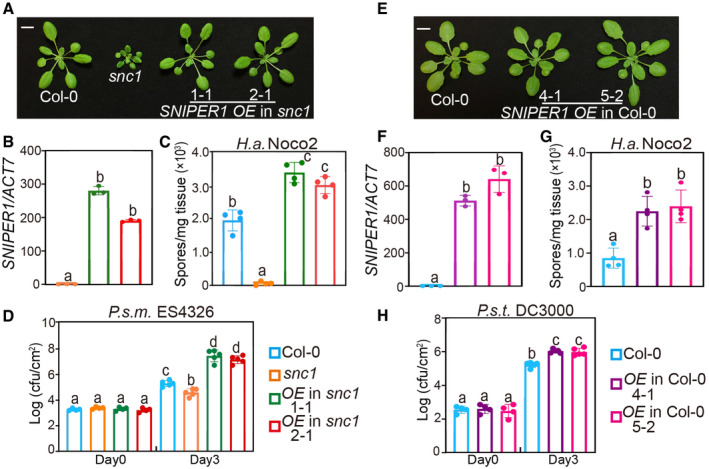
Morphology of 4‐week‐old soil‐grown plants of Col‐0, snc1, and two independent transgenic lines of SNIPER1 OE into snc1 background. OE stands for overexpression of SNIPER1. Scale bar = 1 cm.
SNIPER1 gene expression in the indicated plants as determined by RT‐PCR. Error bars represent mean ± SD (n = 3). Two independent experiments were carried out with similar results.
Quantification of H.a. Noco2 sporulation in the indicated genotypes 7 days post‐inoculation (dpi) with 105 spores per ml water. Error bars represent mean ± SD (n = 4). Three independent experiments were carried out with similar results.
Growth of P.s.m. ES4326 on 4‐week‐old leaves of the indicated genotypes at 0 and 3 dpi with bacterial inoculum of OD600 = 0.001. Error bars represent mean ± SD (n = 4 for day 0; n = 5 for day 3). Three independent experiments were carried out with similar results.
Morphology of 4‐week‐old soil‐grown plants of two independent transgenic lines of SNIPER1 OE in Col‐0 background. Scale bar = 1 cm. No difference in growth and development was observed.
SNIPER1 gene expression in the indicated plants as determined by RT‐PCR. Error bars represent mean ± SD (n = 3). Two independent experiments were carried out with similar results.
Quantification of H.a. Noco2 sporulation in the indicated genotypes at 7 dpi with 105 spores per ml water. Error bars represent mean ± SD (n = 4). Three independent experiments were carried out with similar results.
Growth of P.s.t. DC3000 on 4‐week‐old leaves of the indicated genotypes at 0 and 3 dpi with bacterial inoculum of OD600 = 0.001. Error bars represent mean ± SD (n = 4 for day 0; n = 5 for day 3). Three independent experiments were carried out with similar results.
Data information: Color squares shown on the right of panel (D and H) are for (B–D) and (F–H), respectively. One‐way ANOVA followed by Tukey's
post hoc test were performed for panel (B, C, D, F, G, and H). Statistical significance is indicated by different letters (
P <
0.01).

