-
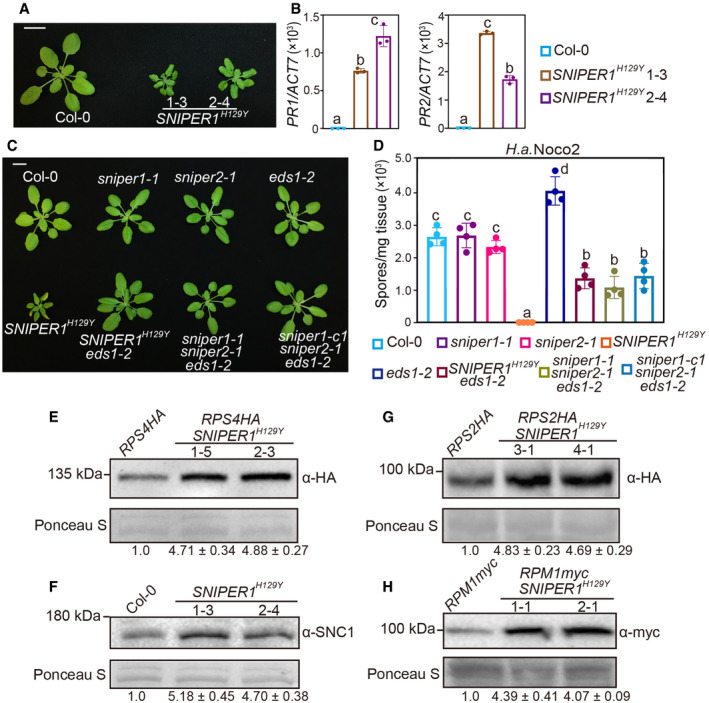
A
Morphology of 4‐week‐old soil‐grown plants of Col‐0 and two independent transgenic lines of 35S‐SNIPER1
H129Y. Scale bar = 1 cm.
-
B
PR1 and PR2 genes expression in the indicated plants as determined by RT‐PCR. Error bars represent mean ± SD (n = 3). Two independent experiments were carried out with similar results.
-
C
Morphology of 4‐week‐old soil‐grown plants of Col‐0, sniper1‐1, sniper2‐1, eds1‐2, SNIPER1
H129Y, SNIPER1
H129Y
eds1‐2, sniper1‐1 sniper2‐1 eds1‐2, and sniper1‐c1 sniper2‐1 eds1‐2. sniper1‐1 is an exonic T‐DNA insertional mutant. sniper1‐c1 is a SNIPER1 knockout mutant containing 807 bp deletion that was generated by CRISPR‐Cas9 system. Scale bar = 1 cm.
-
D
Quantification of H.a. Noco2 sporulation in the indicated plants at 7 dpi with 105 spores per ml water. Error bars represent mean ± SD (n = 4). Two independent experiments were carried out with similar results.
-
E–H
Immunoblot of RPS4HA (E), SNC1 (F), RPS2HA (G), and RPM1myc (H) in SNIPER1
H129Y background. Equal loading is shown by Ponceau S staining of a non‐specific band. The numbers below represent the normalized ratio between the intensity of the protein band and the Ponceau S band ± SD (n = 3). Molecular mass marker in kilo Daltons is indicated on the left. Three independent experiments were carried out with similar results.
Data information: Color squares shown on the right of panel (B) are for panel (B). Color squares for panel (D) are shown below. One‐way ANOVA followed by Tukey's
test were performed for panel (B and D). Statistical significance is indicated by different letters (
0.01).

