Figure 1.

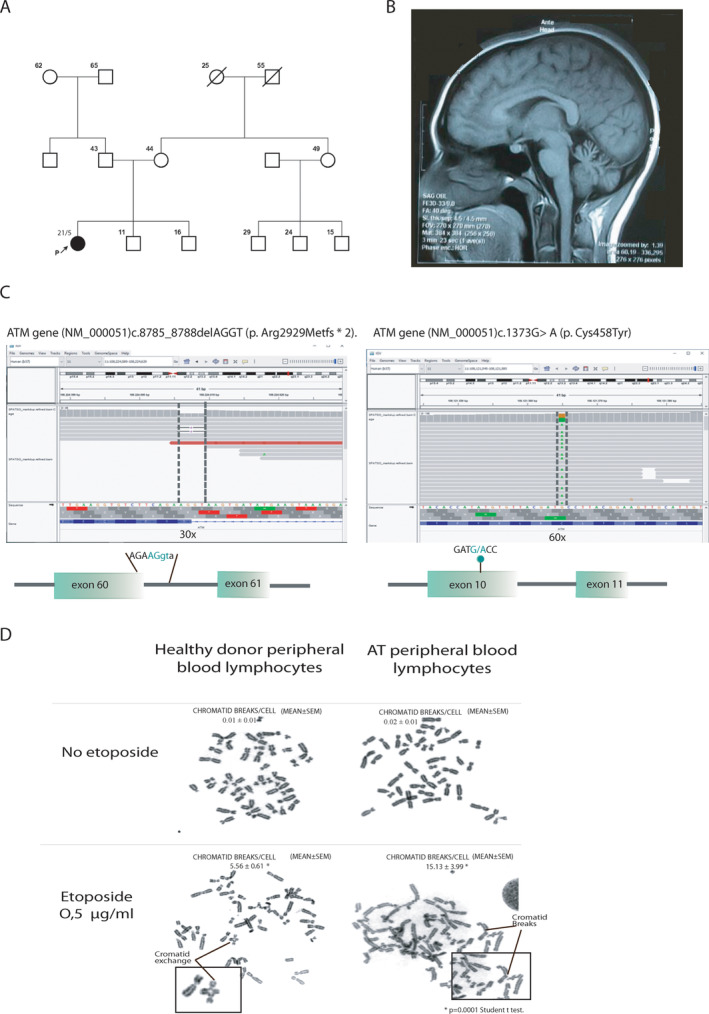
(A) Pedigree chart. Arrow indicates index case. Numbers over figures corresponded to current age/age at onset. (B) Magnetic resonance imaging sagittal T1‐weighted image showing cerebellar atrophy. (C) Alignment showing identified variants in the patient. (D) Chromosomal aberrations (both break and exchange type) following acute treatment with etoposide representative image metaphase containing chromosomal aberrations is shown. AT, ataxia telangiectasia; SEM, standard error of the mean.
