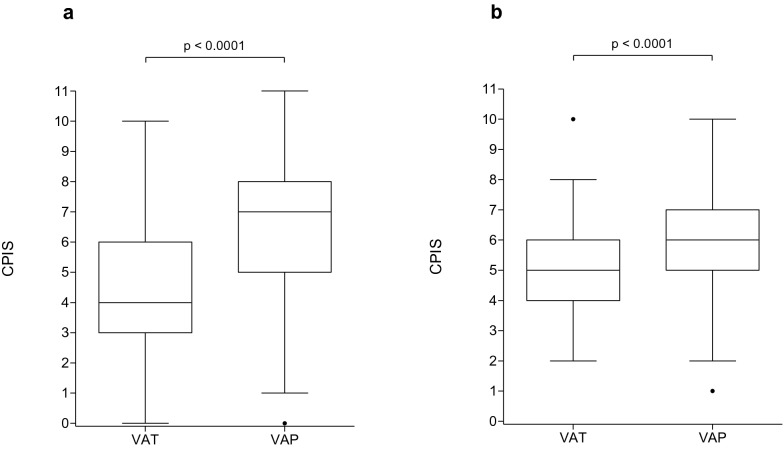
Fig. 1.
Values of CPIS in patients with VAT and VAP in the derivation (a) and validation (b) cohorts. Box plot shows the median (horizontal line) and IQR (25th 75th percentile) (box). The whiskers show the lowest data within 1.5 IQR of the lower quartile and highest data within 1.5 IQR of the upper quartile. Data outside 1.5 IQR of the upper or lower quartiles are depicted with a dot. CPIS Clinical Pulmonary Infection Score; VAP Ventilator-Associated Pneumonia; VAT Ventilator-Associated Tracheobronchitis

