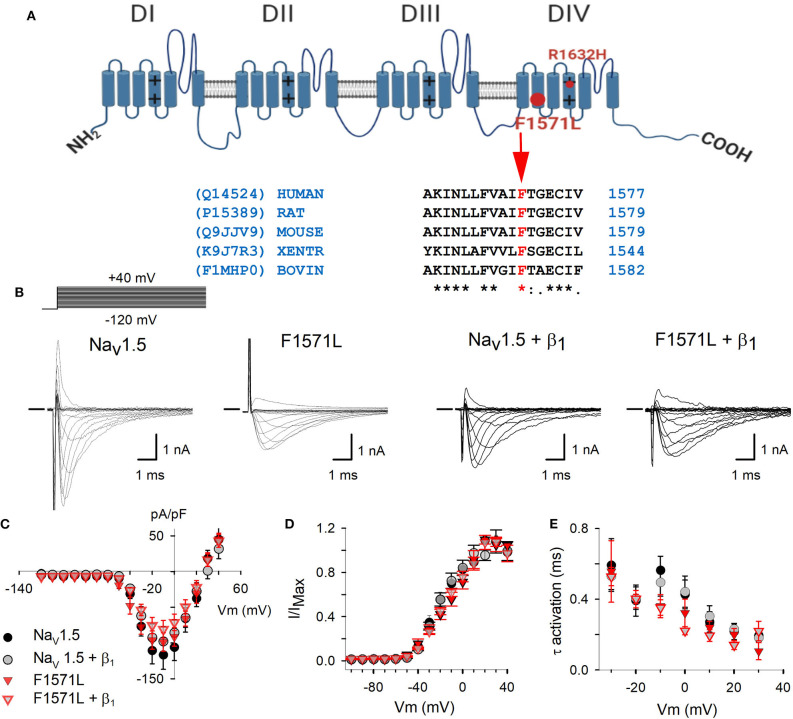
Figure 2.
(A) Schematic representation of the Nav1.5 structure (10) with location of the p.Phe1571Leu variant (big full red circle) and p.Arg1632His (small red circle). The alignment shows the conservation of Phe at position 1571 in SCN5A amino acid sequence between species. The accession numbers for the UniProt database are indicated on the left side. (B) Electrophysiological properties of WT Nav1.5 and Nav1.5-F1571L alone or co-expressed with β1. Displayed from left to right are the representative whole-cell ionic current recordings of WT Nav1.5, Nav1.5-F1571L, WT Nav1.5 + β1, and Nav1.5-F1571L + β1. The Na+-selective currents were elicited with the pulse protocol shown on the left above the traces. The horizontal bar at the beginning of the traces indicates zero current level. (C) Current density of WT Nav1.5 (black circles, n = 8), WT Nav1.5 + β1 (gray circles, n = 9), Nav1.5-F1571L (full red inverted triangles, n = 7), and Nav1.5-F1571L + β1 (open red inverted triangles, n = 9) were obtained by normalizing the peak current amplitudes from pulse protocols shown in (B) to the cell capacitance. (D) Voltage dependence of channel activation, G–V curves, are represented for WT Nav1.5, Nav1.5-F1571L, WT Nav1.5 + β1, and Nav1.5-F1571L + β1. (E) The voltage-dependent kinetics of channel activation are shown as means ± SEM.

