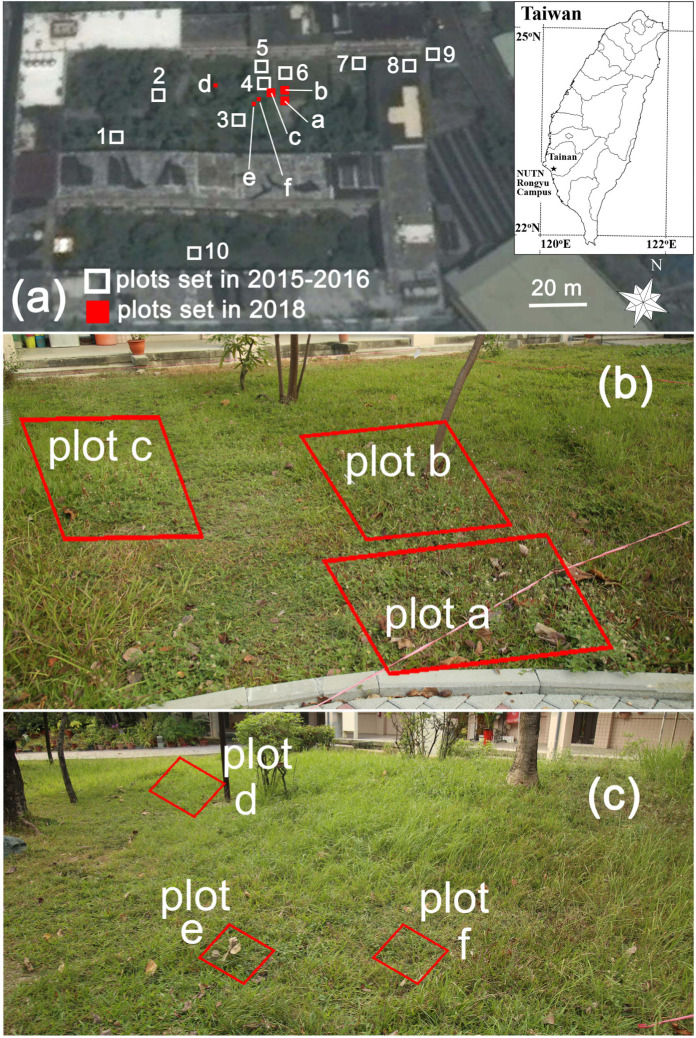
Fig. 1.
(a) Map of Rongyu Campus, National University of Tainan. White squares indicate the plots for the night roosting surveys of butterflies from November 2015 to March 2016 (n = 10). Red squares (plots a–f) are subsites used for the random patterns test, confirming the non-random distribution of the roosting blues within roosting aggregations, as well as for observation of the social and behavioral interactions among individuals during roost-assembly. (b) A closer look of plots a, b, and c. (c) A closer look of plots d, e, and f.

