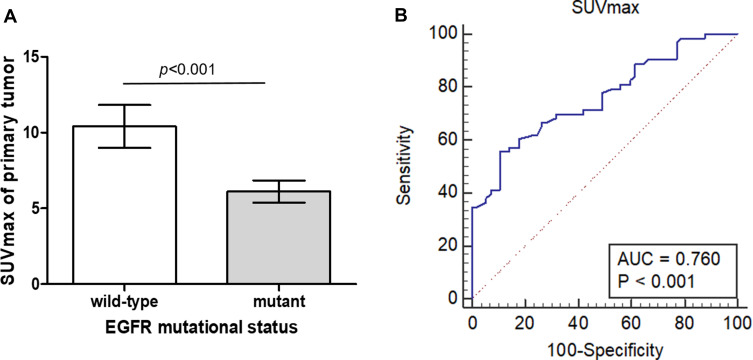
Figure 1.
(A) Box plot of SUVmax of the primary tumor. Mean SUVmax was significantly lower in EGFR-mutated tumors than in EGFR wild-type (6.11 vs 10.41, p < 0.001). Bars indicate 95% confidence interval of mean values. (B) The receiver operating characteristic (ROC) curve of SUVmax for discriminating EGFR mutational status. At the cutoff of 9.6, the AUC was 0.760 (95% CI: 0.673–0.833, p < 0.001).

