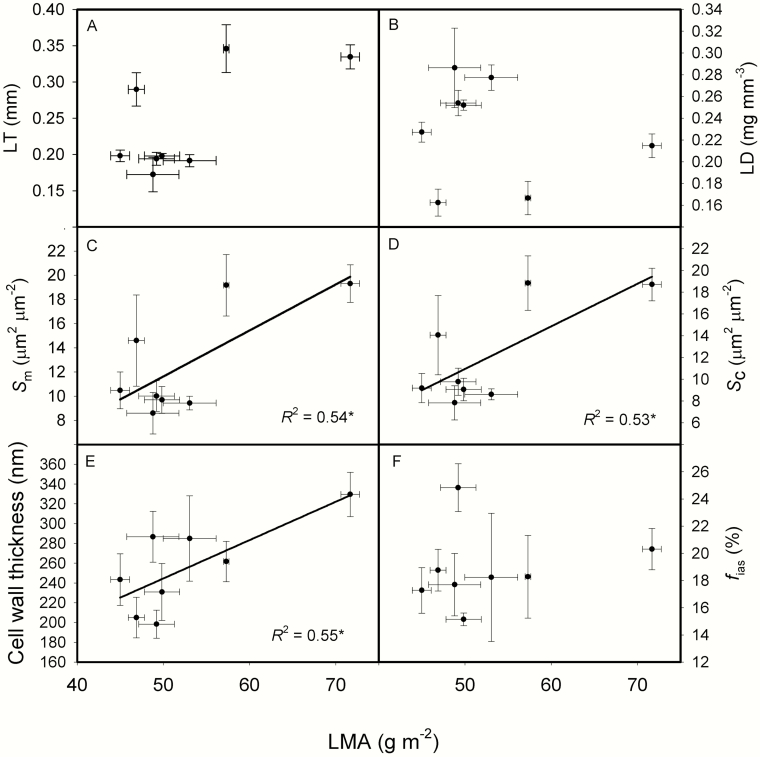
Fig. 2.
The relationships between leaf mass per area (LMA) and leaf thickness (LT, A), leaf density (LD, B), the surface area of mesophyll cells exposed to intercellular airspaces per leaf area (Sm, C), the surface area of chloroplasts exposed to intercellular airspaces per leaf area (Sc, D), cell wall thickness (CWT, E) and the fraction of intercellular airspaces (fias, F) across the eight rice genotypes. Data are means ± SD of three replicates for LMA, LT, LD, Sm, Sc and fias. CWT of each genotype was measured with 5–13 pictures, and one mesophyll cell was measured in each image. *P < 0.05; **P < 0.01; ***P < 0.001.

