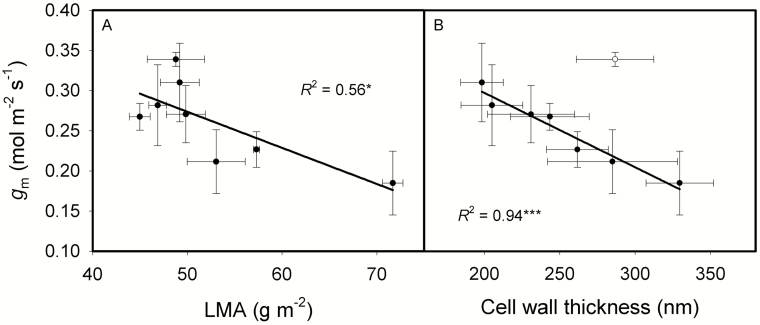
Fig. 4.
The relationships between mesophyll conductance (gm) and leaf mass per area (LMA, A), cell wall thickness (B) across the eight rice genotypes. Data are means ± SD of three replicates for gm and LMA. Cell wall thickness of each genotype was measured with 5-13 pictures, and one mesophyll cell was measured in each picture. *P < 0.05; **P < 0.01; ***P < 0.001.

