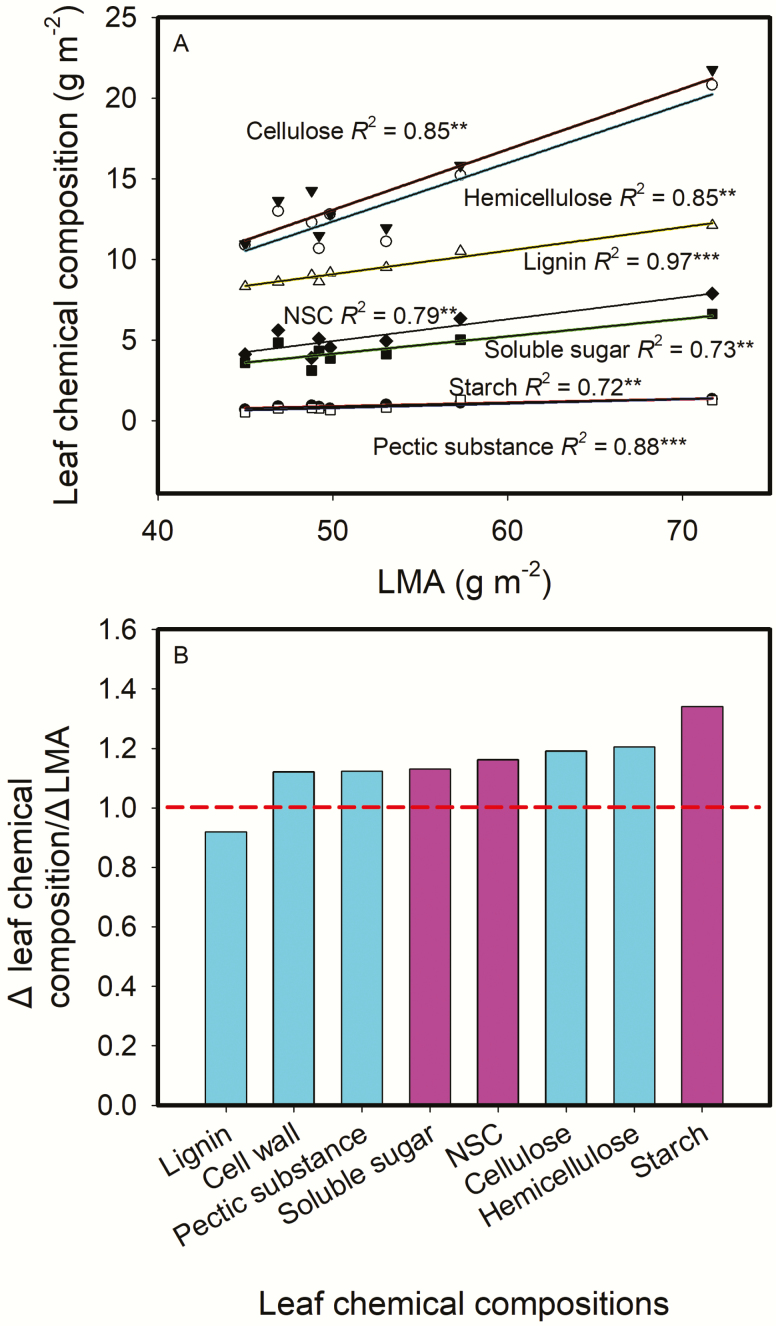
Fig. 6.
Relationships between leaf chemical compositions (based on leaf area) and leaf mass per area (LMA) across the eight rice genotypes (A), and the ratio of Δleaf chemical composition to ΔLMA (B). ΔLMA was calculated as the ratio of the maximum to the minimum LMA across the tested rice genotypes. The obtained regression equations in (A) were used to calculate leaf chemical compositions with the maximum and the minimum LMA, respectively, and Δ leaf chemical composition was calculated as the ratio of the maximum to the minimum leaf chemical compositions. Data are means of three replicates in (A). *P < 0.05; **P < 0.01; ***P < 0.001.

