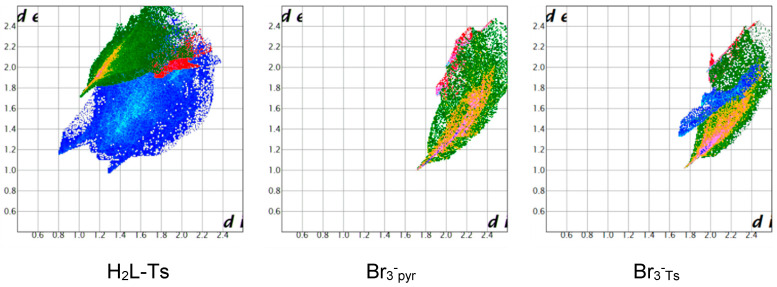
Figure 10.
Ligand (H2L-Ts)2+ and Br3− fingerprint plots. H-bond tip displayed in green hue. Anion-π contacts shown in red. Other interactions in standard fingerprint plot colouring. In the case of Br3− interacting with tosyl group (Br3−Ts), the blue region is associated with the unusual Br3−⋅⋅⋅NO3− contacts.

